Methodology
6 of the sites owned by the RSK group are analysed in depth with respect to their exposure to physical hazards. Different natural hazards are assessed for the present-day and the possible future climate evolution in the years 2030 and 2050, and for the RCP 2.6 and RCP 8.5 scenarios. There are no climate models able to pinpoint specific catastrophic events. However, it is possible to determine the likelihood of future climate hazards and to assess the potential impact of climate change-related risks on business operations.
The future evolution of climate-related hazards is analyzed by comparing the future evolution of some climate impact-drivers (CIDs) to a baseline period (present and near past condition). The methodology followed in this study is that one proposed by the European Topic Centre on Climate Change impacts (Crespi et al., 2020) and the UNEP FIs and the TCFD (Carlin et al., 2023).
It is important to highlight the difference between climate change and weather variability. Weather variability refers to the fluctuations in atmospheric conditions, such as temperature, precipitation, and wind, that occur over short periods of time. Climate change, on the other hand, refers to the long-term alterations in Earth’s climate patterns, including changes in temperature, precipitation, and sea level. While weather variability is a natural occurrence, climate change is primarily caused by human activities, which release large amounts of greenhouse gases into the atmosphere, trapping heat and causing global temperatures to rise. This report analyses the influence of climate change on physical hazards. That means, the statistically significant variations of the climate. To detect climate variations (and not weather variability), the climate variables have to be averaged over a large period, typically 30 years. In this study, the averaged baseline period (from 1970 to 2000) is compared with the averaged medium-term period (from 2015 to 2044) and the long-term period (from 2035 to 2064). In this report, these three periods are named as “historical”, “2030” and “2050”.
The evolution of the future climate is uncertain, and it depends mainly on anthropogenic greenhouse gas emissions. Climate projections provide information for the exploration of climate changes across a range of very different futures. Representative Concentration Pathways (RCPs) are emission scenarios explicitly designed for the climate modelling community to explore the effects of different emissions trajectories or emissions concentrations (van Vuuren et al., 2011). RCPs consist of predictions about how concentrations of greenhouse gases in the atmosphere will change in the future as a result of human activities. The RCPs values refer to a possible range of radiative forcing values in the year 2100 (radiative forcing represents the change in energy flux in the atmosphere caused by natural or anthropogenic factors and it is measured by watts / squared meter. Values commonly used include 2.6, 4.5, 6.0, and 8.5 W/m²) (IPCC AR5, 2014). In this study, the future evolution of the hazards is analyzed under the RCP2.6 and the RCP8.5 scenarios:
RCP2.6 represents a pathway where greenhouse gas emissions are strongly reduced, resulting in a best estimate global average temperature rise of 1.6 °C by 2100 compared to the pre-industrial period.
RCP8.5 is a pathway where greenhouse gas emissions continue to grow unmitigated, leading to a best estimate global average temperature rise of 4.3 °C by 2100 compared to the pre-industrial period.
Thus, the relative change of each climate impact-driver with respect to its historical mean is evaluated, and their impact on the corresponding hazard is estimated. Considering the evolution of each CID, a score is given to each hazard for the periods 2030 and 2050, and for RCP 2.6 and RCP 8.5. These results are presented in the conclusion section of each site.
In this study, 12 climate-related hazards are analyzed for the 6 sites. The analyzed physical hazards and their related baseline indicators and CIDs are summarized in Table 1 and described in the next sub-sections. The methodology followed to score each hazard is described in the CID scoring section.
Physical hazards
The climate-related hazards analyzed in this study can be grouped in four hazard categories (Fig. 1): heat and cold, wet and dry, coastal, and wind-related.
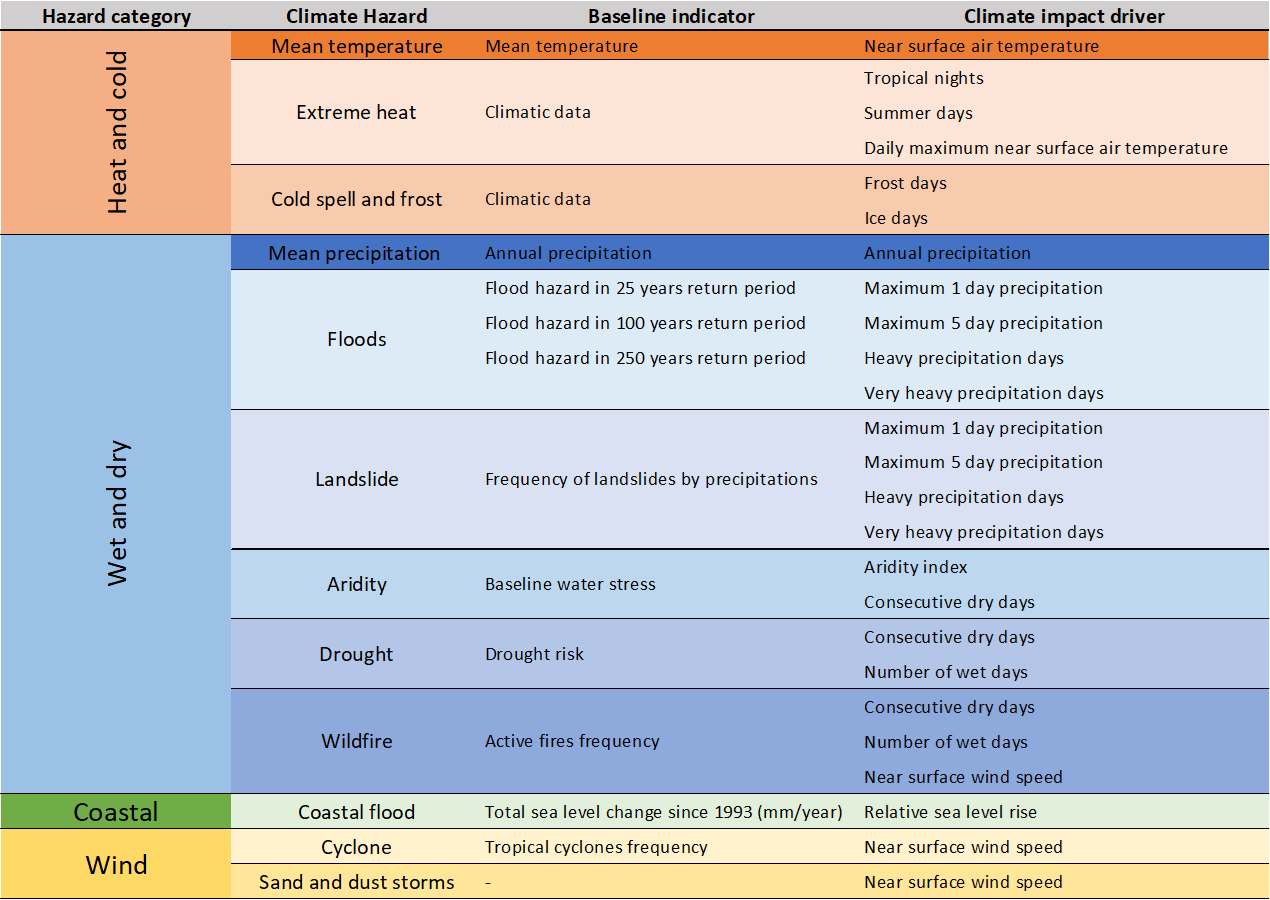
Fig. 2 Summary table of the hazard types and the baseline indicator and CID for each hazard.
In the following section, a description of the climate hazards is provided.
Mean temperature influences ecosystems and a wide range of human activities. The selected CID for this hazard is the near-surface air temperature.
Extreme heat is an important hazard for many sectors and activities, including human health, agriculture, construction, transport and energy. The selected CIDs focus on high temperature extreme conditions.
Cold spell and frost are relevant hazards for several sectors, including agriculture, construction and transport. Their relevance and impacts largely depend on the affected climate zones and system. The selected CIDs account for the frequency of hazardous conditions.
Mean precipitation influences ecosystems and a wide range of human activities. The total annual precipitation is the CID selected for this hazard.
Flooding analyzes pluvial and riverine flooding hazards. Extreme precipitation is an important hazard for many sectors, including hydrological applications, transport and disaster risk management. The selected CIDs indices account for the magnitude and frequency of extreme precipitation.
Landslide is a complex hazard linked to slope failures that cannot be resolved by climate models. Only landslides directly related to precipitation can be estimated. The selected CIDs are, thus, those of the flooding hazard.
Aridity changes represent an important hazard influencing several sectors, including water management, agriculture and energy. Aridity is a natural permanent imbalance in the water availability consisting of low average annual precipitation, with high spatial and temporal variability, resulting in overall low moisture and low carrying capacity of the ecosystems. The selected CIDs indices are based on precipitation and evapotranspiration.
Drought is an important climate-related hazard affecting agriculture, forestry, energy, manufacturing, and water management sectors. Drought is a period of abnormally dry weather that cause a serious hydrological imbalance. Drought differs from aridity in that drought is temporary and it occurs in virtually all climatic regimes. Meteorological drought is analysed through CIDs based on the (absence) of precipitation.
Wildfire is an important hazard for forestry, agriculture, human health and settlements. It can lead to environmental and economic damage, and often results in the loss of human lives. The estimation of future wildfires through climate models is highly complex. The selected CIDs are based on fuel aridity (the drying out of forests and other burnable ecosystems) and the spread of the fires.
Coastal flood is an important hazard in coastal regions, where they can affect buildings, infrastructure, energy and water supply. The selected CID is sea level change relative to land, which is most relevant for coastal adaptation purposes.
Wind-related hazards such as tropical cyclones or sand and dust storms are an important hazard for a wide range of sectors and activities such as human health, forestry, infrastructure, buildings, energy and transport. However, data availability for this hazard is limited, and there are substantial discrepancies between different data sources (e.g. observations and reanalysis). The mean wind speed and its changes are the CID selected to assess such hazard.
Baseline indicators description
The baseline indicators that are used in this study have been selected from different sources. Indicators and sources are those recommended by the United Nations Environment Programme Finance Initiative (Conell et al., 2020) and the Network for Greening the Financial System (NGFS 2022). Earthquake risk has been included in the baseline description of each site despite it is not a climate-related hazard. However, it may be of interest to have information on the present-day earthquake risk. The following is a description of the baseline indicators used in the hereto study, presented in alphabetic order.
Active Fires Frequency (fires/year) per square kilometre between 2003-2021. This data is based on MODIS Collection 6 Active Fire Product MCD14ML. This raster layer was produced by GRID-Geneva. Data accessed in January 2022, at https://wesr.unepgrid.ch/static.html?views=MX-L15E1-3Y3QV-N85AA&zoomToViews=true. Source: MODIS.
Drought risk measures where droughts are likely to occur, the population and assets exposed, and the vulnerability of the population and assets to adverse effects. Higher values indicate a higher risk of drought. The drought risk indicator is based on Carrão et al. (2016) and is used with minimal alterations. Source Aqueduct.
The flood hazard in a 25 years return period is the expected water level in meters for a such flood event. Source: WRI - Aqueduct Floods.
The flood hazard in a 100 years return period is the expected water level in meters for a such flood event. Source: WRI - Aqueduct Floods.
The flood hazard in a 250 years return period is the expected water level in meters for a such flood event. Source: WRI - Aqueduct Floods.
Frequency of landslides is an estimate of the annual frequency of landslides triggered by precipitation. It depends on the combination of trigger and susceptibility defined by six parameters: slope factor, lithological (or geological) conditions, soil moisture condition, vegetation cover, precipitation and seismic conditions. Unit is expected annual probability and percentage of pixel of occurrence of a potentially destructive landslide event x 1000000. This product was designed by International Centre for Geohazards (NGI) for the Global Assessment Report on Risk Reduction (GAR). It was modelled using global data.
Peak Ground Acceleration (PGA) (cm/s2) in a 475 years return period earthquake. The PGA can be related to the intensity of the earthquake. The intensity measures the effect of an earthquake on the Earth’s surface and it is measured with the modified Mercalli scale. This data describes the seismic activity based on historical records and on relationships to obtain hazard intensities as a function of magnitude and distance. The PGA global analysis was developed by CIMNE and INGENIAR Ltda. for the Global Assessment Report Atlas. More details about the probabilistic seismic hazard analysis can be found in Cardona et al. (2015).
Sea level change since 1993 (mm/yr) is the average elevation change of the sea surface for the period between 1993 and 2021. Data was retrieved on 14 March 2023 from the NOAA Laboratory for Satellite Altimetry. Source NOAA.
Tropical Cyclones Frequency in events per year, is an estimate of the tropical cyclone frequency of Saffir-Simpson category 5. It is based on two sources: IBTrACS, compilation and GIS processing UNEP/GRID-Geneva .It is the expected average number of events per 100 years multiplied by 100. This product was designed by UNEP/GRID-Geneva for the Global Assessment Report on Risk Reduction.
Water stress measures the ratio of total water withdrawals to available renewable surface and groundwater supplies. Water withdrawals include domestic, industrial, irrigation, and livestock consumptive and nonconsumptive uses. Available renewable water supplies include the impact of upstream consumptive water users and large dams on downstream water availability. Higher values indicate high competition among users. Source Aqueduct.
Climate impact-drivers description
The climate impact-drivers used in this analysis come from three sources: the CMIP6 database, the Climate extreme indices (CEI) data base, and the Sea level Projection Tool. All of them correspond to the most up-to-date model phase (6) of the intercomparison project of the Intergovernmental Panel on Climate Change (IPCC).
The CMIP6 and the CEI databases are taken from the Copernicus Climate Change Service (C3S) that combines climate system observations with the latest science to develop authoritative, quality-assured information about the past, current and future states of the climate in Europe and worldwide. The European Centre for Medium-Range Weather Forecasts (ECMWF) operates C3S on behalf of the European Union and brings together expertise from across Europe to deliver the service.
The Sea Level Projection Tool is a service provided by NASA and the IPCC.
The climate impact-drivers used in this study are compiled in the following table:
Name |
Units |
Description |
Source |
|---|---|---|---|
Aridity index |
(-) |
Ratio between the precipitation and the evaporation (including sublimation and transpiration). This CID should lay between 0-1, although there may be values larger than one because the estimation is done with potential evapotranspiration instead of actual evapotranspiration. Large values indicates larger aridity. It is a CID generated by the division of evapotranspiration and precipitation. |
CMIP6 |
Daily maximum near surface air temperature |
Celsius degree |
Daily maximum temperature of air at 2m above the surface of land, sea or inland waters. |
CMIP6 |
Daily minimum near surface air temperature |
Celsius degree |
Daily minimum temperature of air at 2m above the surface of land, sea or inland waters. |
CMIP6 |
Evaporation including sublimation and transpiration |
mm/yr |
The transfer of latent heat (resulting from water phase changes, such as evaporation, condensation, sublimation and transpiration) between the Earth’s surface and the atmosphere through the effects of turbulent air motion. Evaporation from the Earth’s surface represents a transfer of energy from the surface to the atmosphere. It indicates a vector component which is positive when directed downward (negative upward). |
CMIP6 |
Near surface air temperature |
Celsius degree |
Temperature of air at 2m above the surface of land, sea or inland waters. 2m temperature is calculated by interpolating between the lowest model level and the Earth’s surface, taking account of the atmospheric conditions. |
CMIP6 |
Near surface wind speed |
m/s |
Magnitude of the two-dimensional horizontal air velocity near the surface. |
CMIP6 |
Precipitation |
mm/yr |
The sum of liquid and frozen water, comprising rain and snow, that falls to the Earth’s surface. It is the sum of large-scale precipitation and convective precipitation. This parameter does not include fog, dew or the precipitation that evaporates in the atmosphere before it lands at the surface of the Earth. This variable represents amount of water per unit area and time. |
CMIP6 |
Consecutive dry days |
day |
Maximum number of days in a row with precipitation below 1 mm in a year. If a dry spell does not end in a particular year and spans a period longer than 1 year (as may happen in very dry regions), then CDD is not reported for that year and the accumulated dry days are carried forward to the year when the spell ends. |
CEI |
Frost days |
day |
Annual count of days when daily minimum temperature < 0 degree C. |
CEI |
Heavy precipitation days |
day |
Number of days per year with 10 mm or more precipitation. Precipitation is deposition of water on the Earths surface, either rain, snow, ice or hail. |
CEI |
Ice days |
day |
Annual count of days when daily maximum temperature < 0 degree C. |
CEI |
Maximum 1 day precipitation |
mm |
Maximum precipitation on a single day in period (year or month). Precipitation is deposition of water on the Earths surface, either rain, snow, ice or hail. |
CEI |
Maximum 5 day precipitation |
mm |
Maximum precipitation in five consecutive days in the given period (month or year). Precipitation is deposition of water on the Earths surface, either rain, snow, ice or hail. |
CEI |
Number of wet days |
day |
Number of days per year with 1 mm or more precipitation. Precipitation is deposition of water on the Earths surface, either rain, snow, ice or hail. |
CEI |
Simple daily intensity index |
mm/day |
Total annually summed precipitation on wet days (days with >= 1mm), divided by total number of wet days. Precipitation is the deposition of water on the Earth’s surface, either rain, snow, ice or hail. |
CEI |
Summer days |
day |
Annual count of days when daily maximum temperature > 25 degree C. |
CEI |
Tropical nights |
day |
Annual count of days when daily minimum temperature > 20 degree C. |
CEI |
Very heavy precipitation days |
day |
Number of days per year with 20 mm or more precipitation. Precipitation is deposition of water on the Earths surface, either rain, snow, ice or hail. |
CEI |
Relative sea level rise |
m |
Median projections of global and regional sea level rise, relative to a 1995-2014 baseline. Details of the sea level projections are provided in Box TS.4 and section 9.6 of the Working Group 1 contribution to the Intergovernmental Panel on Climate Change Sixth Assessment Report. |
Sea level Projection Tool |
Climate impact-drivers scoring
The scoring of the CIDs is used to inform our understanding of the physical hazard magnitude in the risk assessment. The estimated physical risk change of each of the hazards is graded between large decrease to large increase based on the relative change of each CID with respect to its historical mean. The mid (2030) and large (2050) terms are evaluated.
Some of the hazards are non-relevant for a site. This is typically the case of coastal-related hazards in an area located far from the coast or extreme temperature events (heat waves or cold spells and frosts) in climatic areas where such events do not occur. The geographical and current climatic conditions (described in the Background and Baseline section of each site report) are the information used to define if a hazard is graded as “non-relevant” for each site.
The rest of the hazards are evaluated based on the relative variation of each CID, except for the sea level rise, which is evaluated as absolute variation (Fig. 2). The future change of the CIDs is evaluated for the 2030 and 2050 time periods. Depending on the percentage of variation, the change is scored as: large decrease, decrease, no significant change, increase, or large increase. The projected variation of the CID is coloured based on its influence on the corresponding hazard. If a CID is positively correlated to a hazard, an increase in the CID leads to an increase in the hazard. If a CID is negatively correlated to a hazard, an increase in the CID leads to a decrease in the hazard. For instance, consecutive dry days in a year are positively correlated with drought. The more consecutive days without precipitation, the larger the risk of drought. On the contrary, the number of wet days in a year is negatively correlated with drought. The relative changed values assigned to the CIDs and their correlation with each hazard are shown in Fig. 2.
The impact of the CID evolution on the hazard is not evaluated for the mean temperature and precipitation. These CIDs correspond to chronic variations in climate, and they are correlated positively or negatively to a hazard depending on the site climate. An increase in the mean temperature can exacerbate risk in hot climates, while it can be beneficial in a cold climate.
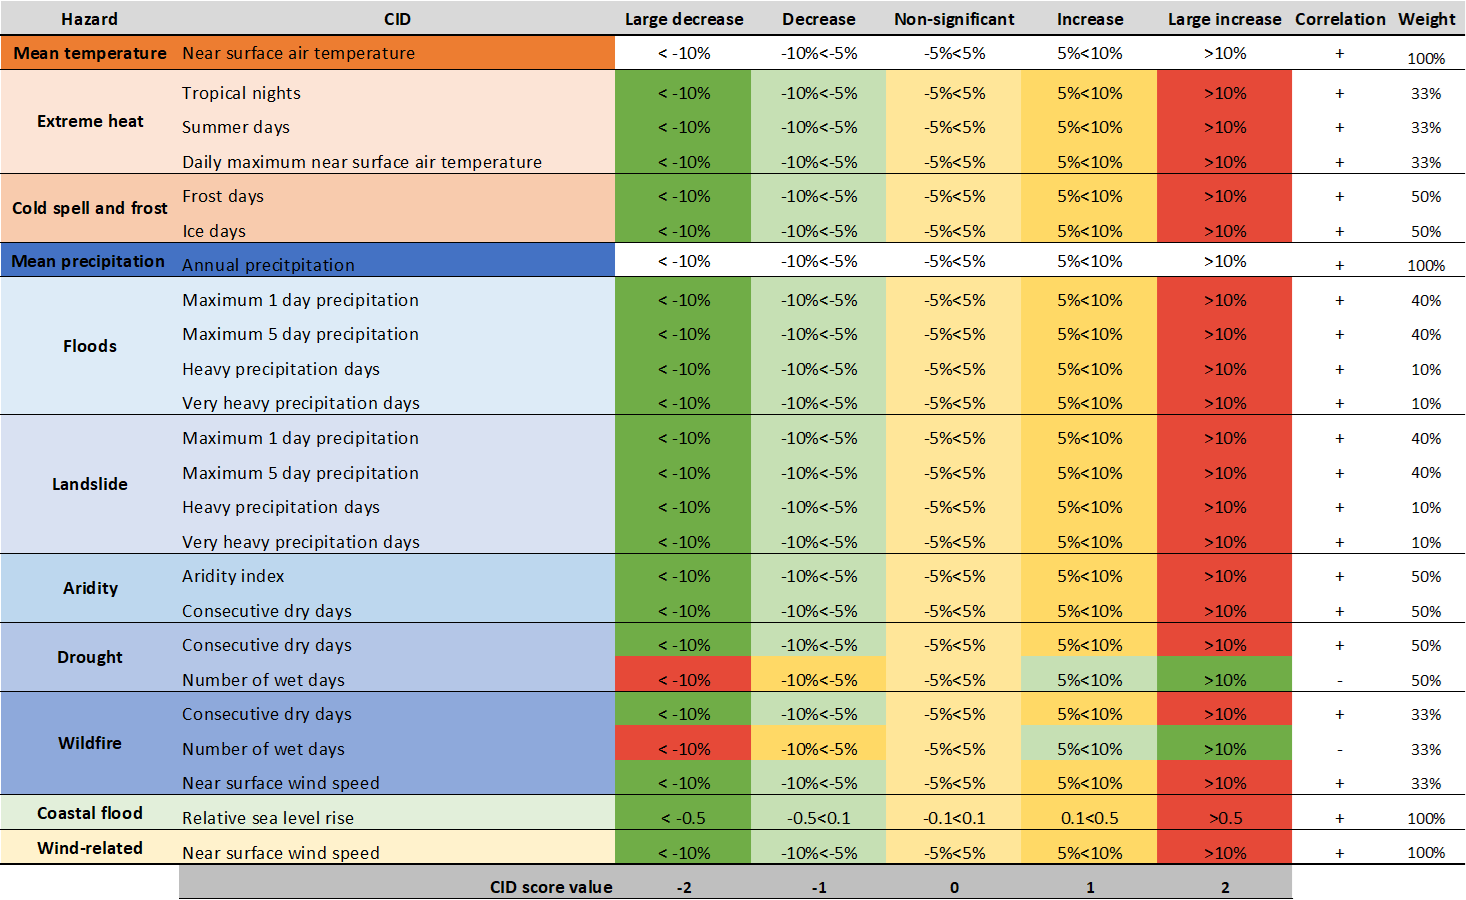
Depending on the variation of the CID, a score value ranging from -2 (large decrease) to 2 (large increase) is assigned to each CID (Fig. 2). This score value is used to evaluate the potential physical risk associated with each hazard with the following formula:
where the hazard score is equal to the summation of the CID score multiplied by its correlation to the hazard and by its weight. This equation leads to values between -2 and 2. The potential physical risk associated with each hazard is, then, graded as it is done for each individual CID: large decrease (lower than -1.5 in dark green), increase (between -0.5 and -1.5 in light green), no significant change (between -0.5 and 0.5 in yellow), increase (between 0.5 and 1.5 in orange) and large increase (larger than 1.5 in red).
Climate impact-drivers bias correction
Climate models are known to have systematic errors, also known as biases, in their output. These biases can result in climate models generating too many rainy days and underestimating rainfall extremes, errors in the timing and amount of seasonal rainfall, or consistent overestimation or underestimation of temperatures. These errors can originate due to a range of factors such as limited spatial resolution, simplified thermodynamic processes and physics, or incomplete understanding of the global climate system. Consequently, using uncorrected outputs from these models in impact assessment studies can yield unrealistic results.
To address these biases, several bias correction methods exist. The method used in this report is the Delta change method, a direct approach often used in climate impact research to correct biases. This method includes using the response of models to climate change to modify observations. For example, if the climate model predicts a 3°C temperature increase, 3°C is added to all historical temperature observations to construct a new time series for future climate. Similarly, for rainfall, a percentage change is calculated, and a new time series is created by multiplying the historical rainfall by the percentage change predicted by the climate model. This method does not account for changes in climate variability, such as increasing extreme rainfall or longer dry spells.
Observation data used as a reference for adjusting biases is sourced from WorldClim. The biased corrected CIDs variables will have the (bc) suffix to signify that they have been adjusted to data. Notice that not adjusted data should be used carefully when the model values are far from the observations, interpreting them in order to visualize trends rather than as an absolute value.
Data sources
Aqueduct 3.0: Updated Decision- Relevant Global Water Risk Indicators. Hofste, R., S. Kuzma, S. Walker, E.H. Sutanudjaja, et. al. (2019). Technical Note. Washington, DC: World Resources Institute. DOI: https://doi.org/10.46830/writn.18.00146 (Accessed on March-2023).
Cardona Arboleda, O. D., Ordaz Schroeder, M. G., Salgado Gálvez, M. A., Bernal Granados, G. A., Mora, M., Zuloaga Romero, D., … & Marulanda Fraume, M. C. (2015). Evaluación probabilista del riesgo sísmico para el GAR 2015. In Estado del arte de ingeniería sísmica en Colombia: VII Congreso Nacional de Ingeniería Sísmica 2015 (pp. 1-9).
Carlin, D., Falk, J., Johnson, D., Li, W., & Lorkowski, L. (2023). The 2023 Climate Risk Landscape. UNEP FI’s 2022 Climate Risk and Task Force on Climate-Related Financial Disclosures (TCFD) Programme.
Carrão, H., G. Naumann, and P. Barbosa. 2016. “Mapping Global Patterns of Drought Risk: An Empirical Framework Based on Sub-national Estimates of Hazard, Exposure and Vulnerability.” Global Environmental Change 39 (July): 108–24. doi: https://doi.org/10.1016/j.gloenvcha.2016.04.012.
Climate extreme indices (CEI) and heat stress indicators derived from CMIP6 global climate projections. Sandstad, M., Schwingshackl, C., Iles, C., (2022). Copernicus Climate Change Service (C3S) Climate Data Store (CDS). DOI: https://doi.org/10.24381/cds.776e08bd. (Accessed on March-2023). The data are retrieved from the HADGEM-GC31-MM model.
CMIP6 climate projections. Copernicus Climate Change Service (C3S) Climate Data Store (CDS) (2021). DOI: https://doi.org/10.24381/cds.c866074c (Accessed on March-2023). The data are retrieved from the HADGEM-GC31-MM model.
Ridley, Jeff; Menary, Matthew; Kuhlbrodt, Till; Andrews, Martin; Andrews, Tim (2019). MOHC HadGEM3-GC31-MM model output prepared for CMIP6 CMIP historical. Version YYYYMMDD[1].Earth System Grid Federation. https://doi.org/10.22033/ESGF/CMIP6.6112
Connell, Richenda, Robin Hamaker-Taylor, Bob Khosa, John Firth, Amanda Rycerz, Sophie Turner, Erin Owain, et al.. 2020. “Charting a New Climate: TCFD Banking Programme Report”. UNEP Finance Initiative. https://www.unepfi.org/industries/banking/charting-a-new-climate/
Copernicus Climate Change Service (C3S) Climate Data Store (CDS) (2021). https://cds.climate.copernicus.eu/cdsapp#!/home
Crespi A., Terzi S., Cocuccioni S., Zebisch M., Berckmans J., Füssel H-M (2020) “Climate-related hazard indices for Europe”. European Topic Centre on Climate Change impacts, Vulnerability and Adaptation (ETC/CCA) Technical Paper 2020/1. DOI: https://doi.org/10.25424/cmcc/climate_related_hazard_indices_europe_2020
Fick, S.E. and R.J. Hijmans, 2017. WorldClim 2: new 1km spatial resolution climate surfaces for global land areas. International Journal of Climatology 37 (12): 4302-4315. https://doi.org/10.1002/joc.5086
Giglio, L., Schroeder, W., and Justice, C. O., 2016, The Collection 6 MODIS active fire detection algorithm and fire products. Remote Sensing of Environment, 178:31-41.
IBTrACS v02r01 (1969 - 2008, http://www.ncdc.noaa.gov/oa/ibtracs/), year 2009 completed by online data from JMA, JTWC, UNISYS, Meteo France and data sent by Alan Sharp from the Australian Bureau of Meteorology.
IPCC (2014). Climate Change 2014 Synthesis Report. Available at: https://www.ipcc.ch/site/assets/uploads/2018/02/SYR_AR5_FINAL_full.pdf.
Global Assessment Report on Disaster Risk Reduction, ISDR (2015) , United Nations, Geneva, Switzerland. Available at the UNEP/UNISDR Global Risk Data Platform (https://wesr.unepgrid.ch/?project=MX-XVK-HPH-OGN-HVE-GGN&language=enº).
The MODIS active fire product detects fires in 1 km pixels that are burning at the time of overpass under relatively cloud-free conditions using a contextual algorithm. More details on the MODIS active fire can be found in Giglio et al.(2016).
NGFS (2022) Physical Climate Risk Assessment: Practical Lessons for the Development of Climate Scenarios with Extreme Weather Events from Emerging Markets and Developing Economies. Technical document. . https://www.ngfs.net/sites/default/files/media/2022/09/02/ngfs_physical_climate_risk_assessment.pdf
NOAA Laboratory for Satellite Altimetry. https://www.star.nesdis.noaa.gov/star/index.php. Data was retrieved on 14 March 2023.
Sea Level Projection Tool of the NASA and IPCC. https://sealevel.nasa.gov/ipcc-ar6-sea-level-projection-tool# .Data was retrieved on 14 March 2023.
UNEP/GRID-Geneva has modelled the dat based on an initial equation from Greg Holland, which was further modified to take into consideration the movement of the cyclones through time.
van Vuuren, D.P., Edmonds, J., Kainuma, M. et al. The representative concentration pathways: an overview. Climatic Change, 2011, 109, 5. https://doi.org/10.1007/s10584-011-0148-z
Ward, P., Jongman, B., Salamon, P. et al. Usefulness and limitations of global flood risk models. Nature Clim Change 5, 712–715 (2015). https://doi.org/10.1038/nclimate2742
Ward, P.J., H.C. Winsemius, S. Kuzma,M.F.P. Bierkens, A. Bouwman, H. de Moel, A. Díaz Loaiza, et al. 2020. “Aqueduct Floods Methodology.” Technical Note. Washington, D.C.: World Resources Institute. Available online at: https://www.wri.org/research/aqueduct-floods-methodology.
WorldClim is a database of high spatial resolution global weather and climate data. These data can be used for mapping and spatial modelling. Historical climate data with a grid resolution of 2.5x2.5 minutes was retrieved on 20 March 2023. https://www.worldclim.org/data/worldclim21.html. See Fick et al. (2017) for further details.
The WRI - Aqueduct Floods represent the flood hazard as inundation depth (m) at a 30”x30” resolution at a global scale for several return periods (5, 10, 25, 50, 100, 250, 500, 1000 years). The hazard has been simulated without considering the presence of flood protection. More details on the flood hazard calculation methodology can be found in Ward et al. (2020). More information about the flood hazard assessment and its usability and limitations can be found in Ward et al. (2015).