Amphos 21 Barcelona
Background
Barcelona is located in the northeast coast of the Iberian Peninsula, facing the Mediterranean Sea, on a plain limited by the mountain range of Collserola, the Llobregat river to the southwest and the Besòs river to the north. Amphos 21 office in Barcelona is located at an elevation of approximately 6 m above sea level.
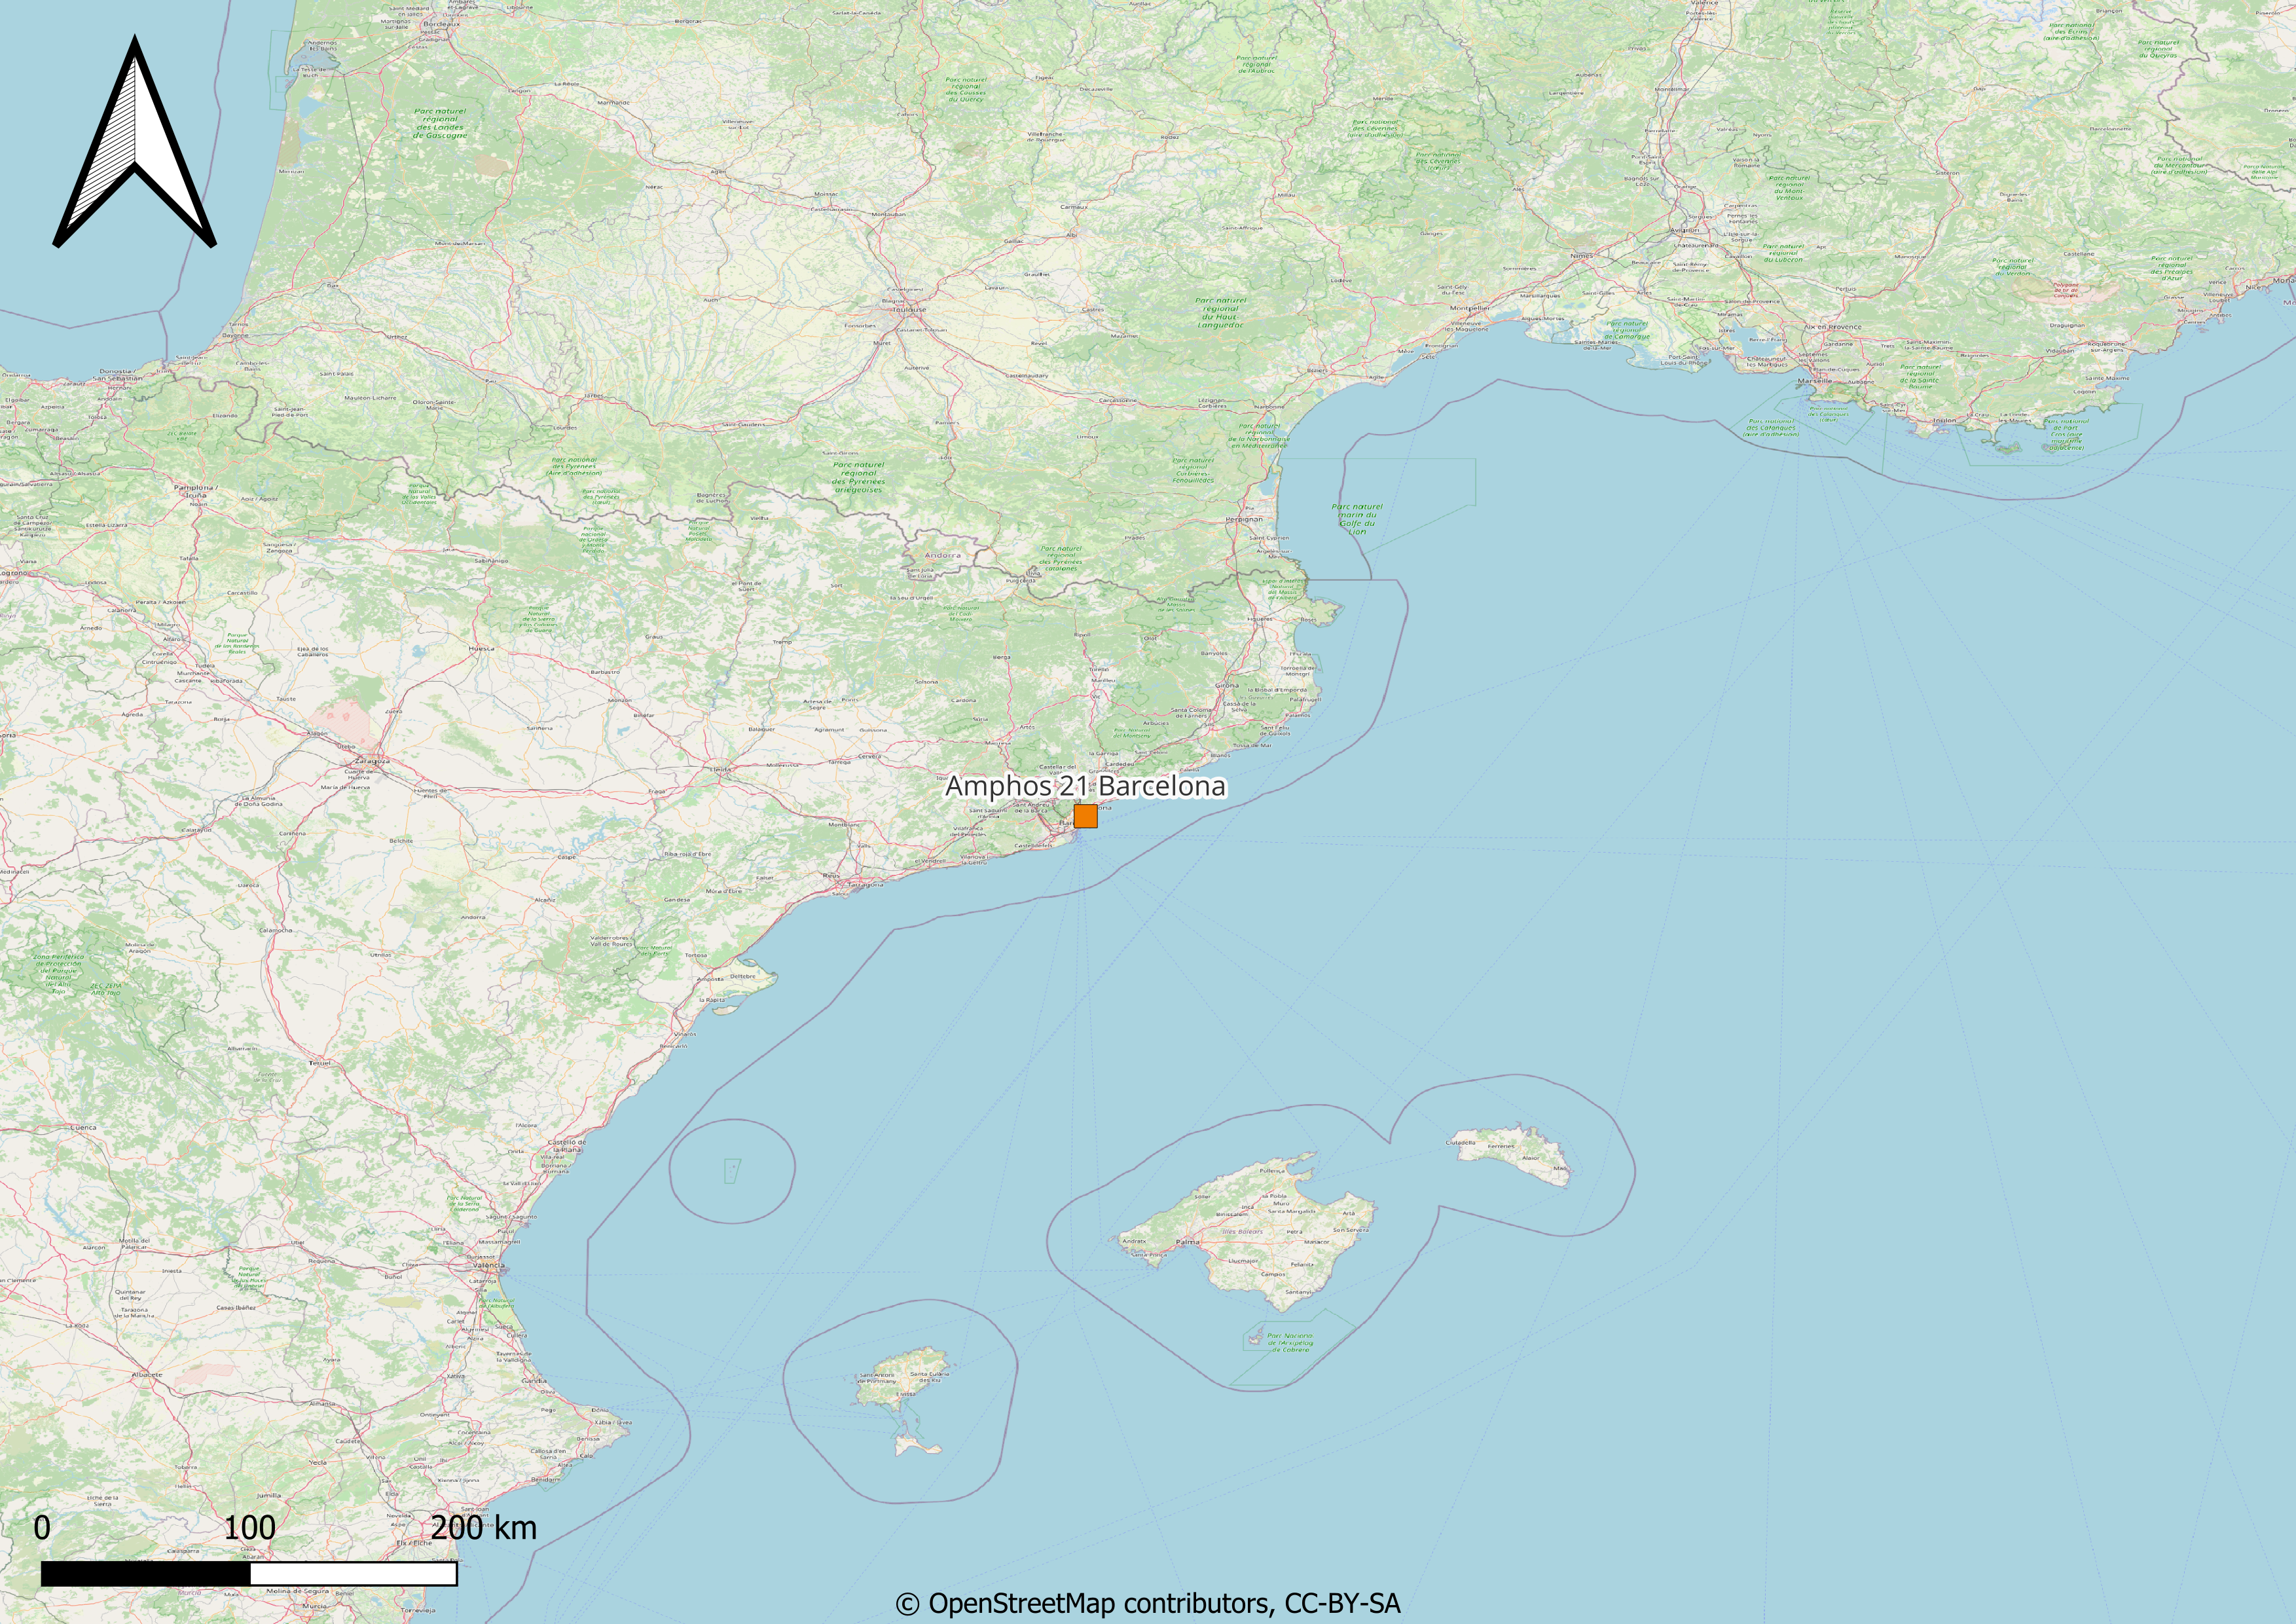
Fig. 3 Location of the Amphos office in Barcelona.
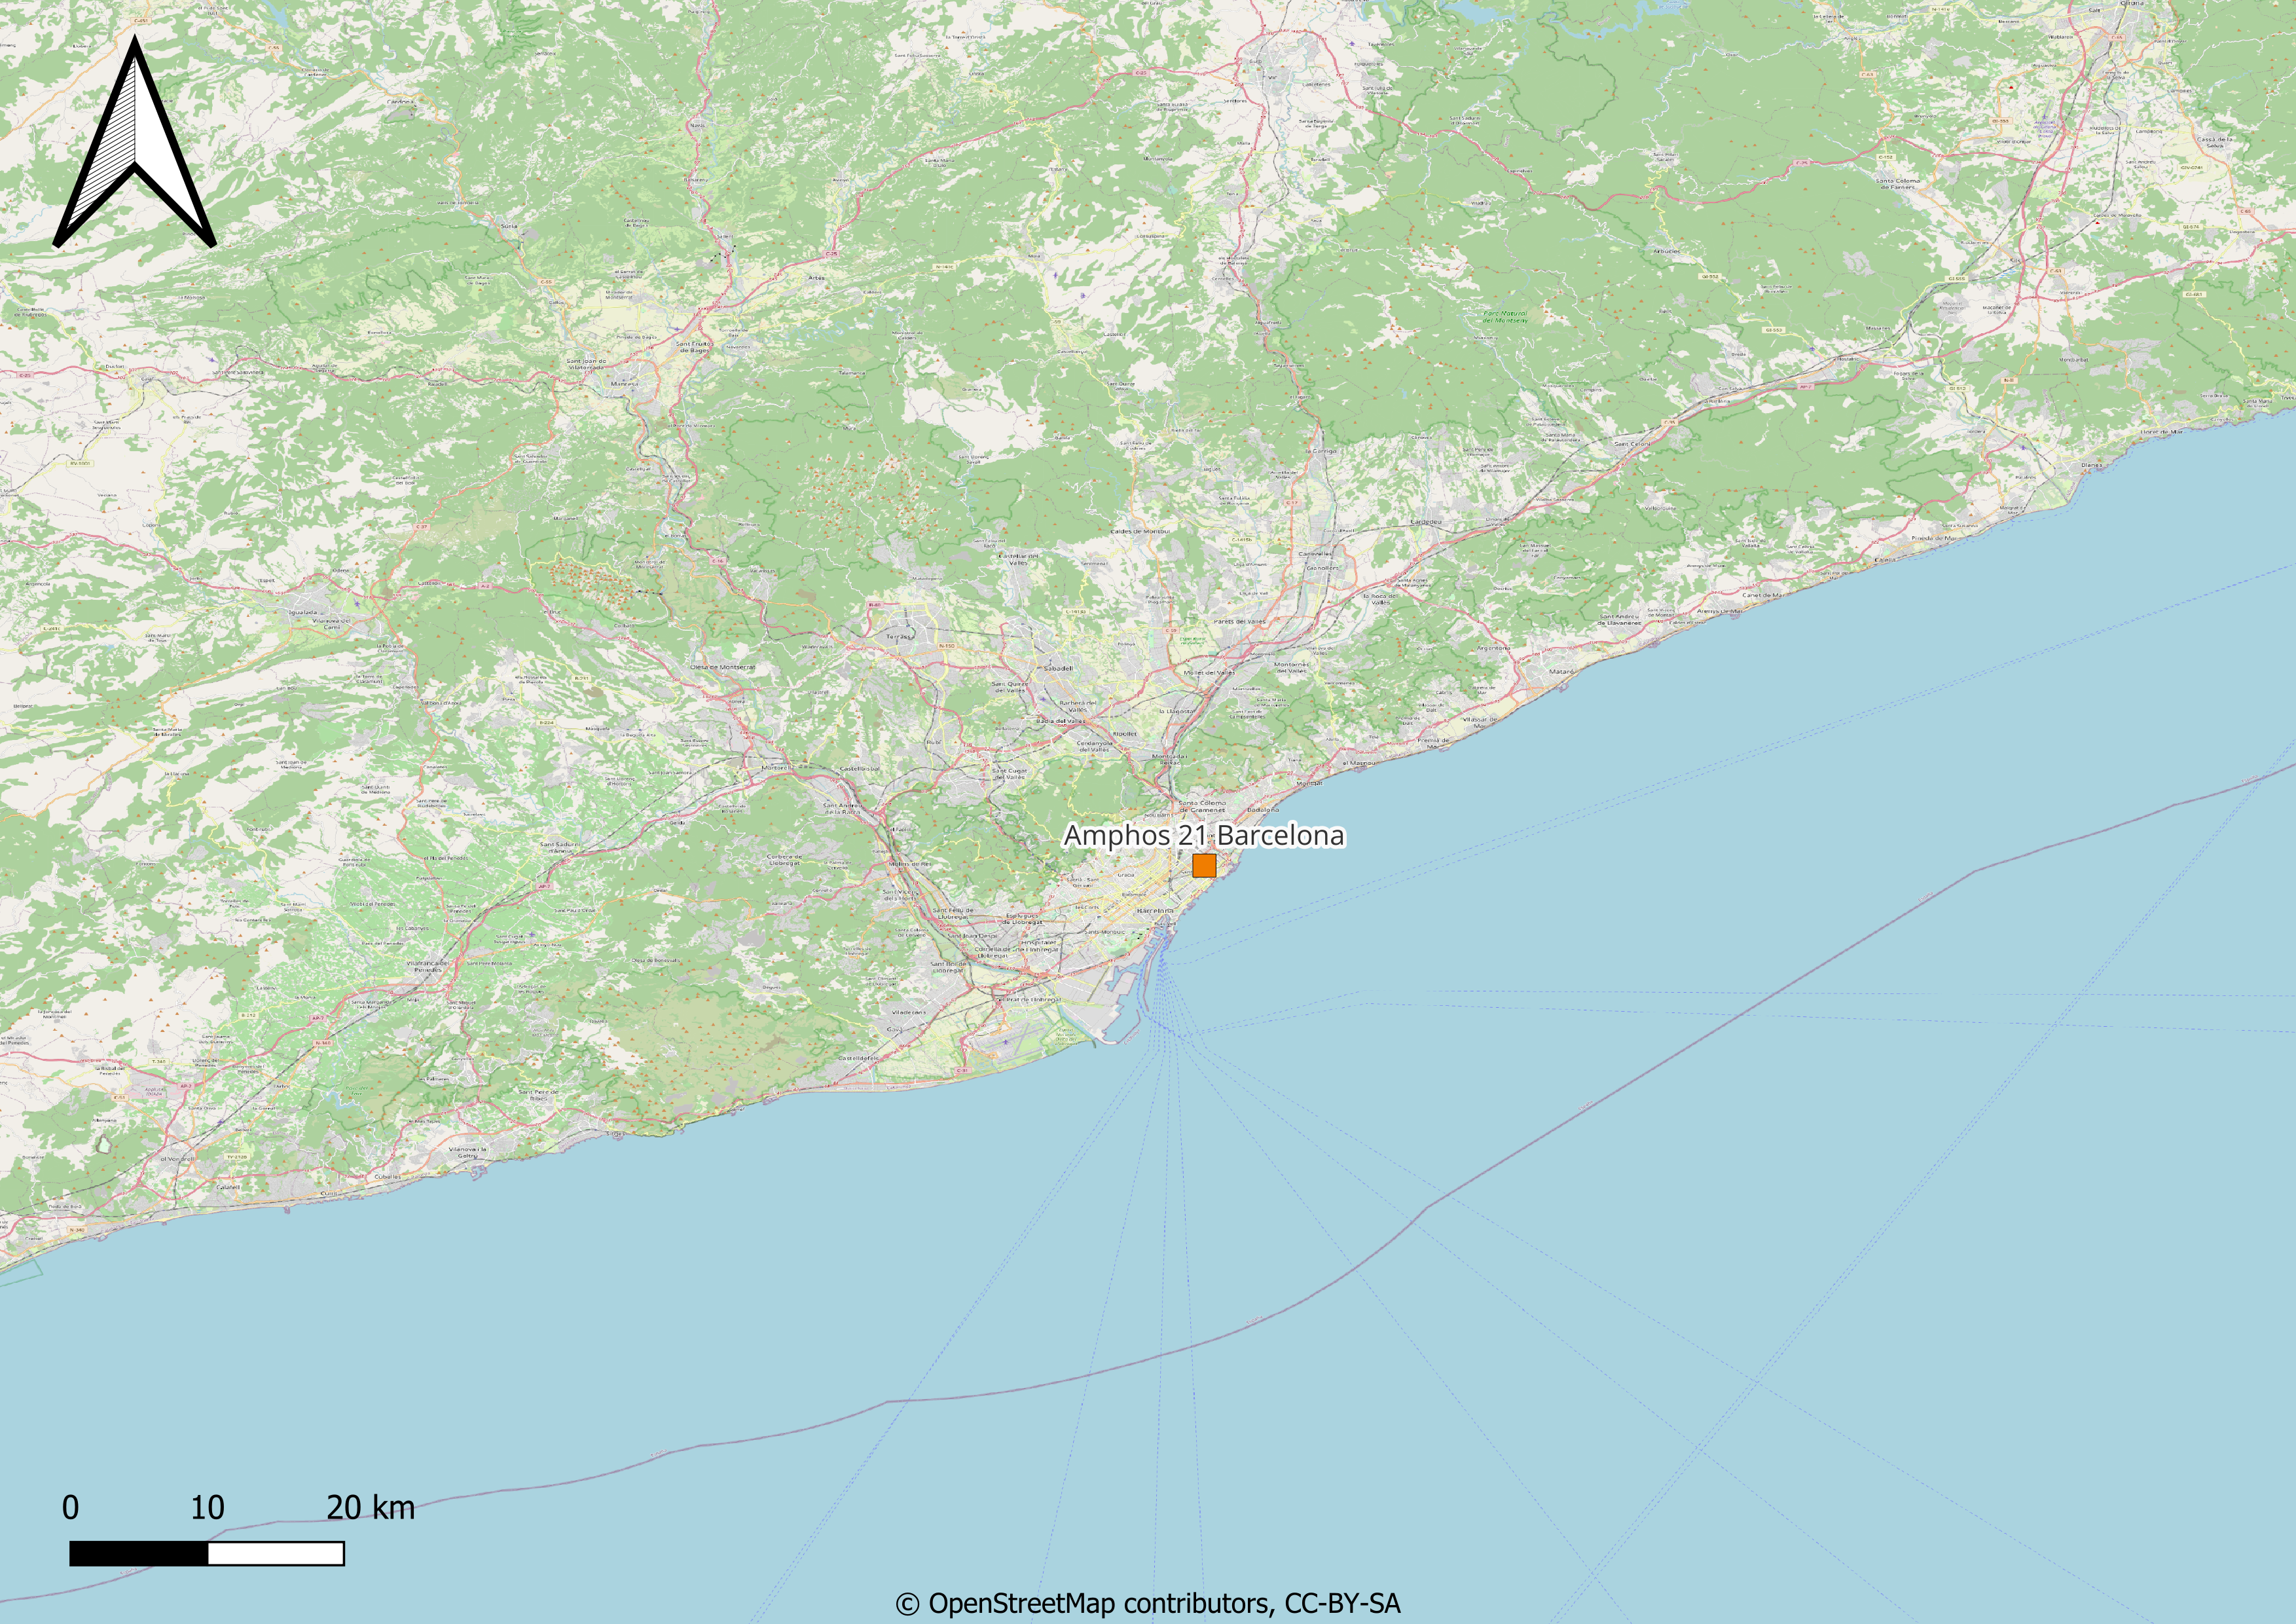
Fig. 4 Detailed location of the Amphos 21 office in Barcelona.
Natural risk past events
No climate-related past events or special adaptation measures have been reported from the Barcelona facility.
Current Baseline
Barcelona has a hot summer Mediterranean climate (Csa), with mild winters and warm to hot summers, while the rainiest seasons are autumn and spring. Summers in Barcelona are warm and dry, with frequent heatwaves, while winters are temperate and more humid.
Variable |
Jan |
Feb |
Mar |
Apr |
May |
Jun |
Jul |
Aug |
Sep |
Oct |
Nov |
Dec |
Year |
|---|---|---|---|---|---|---|---|---|---|---|---|---|---|
Minimum temperature (°C) |
4.9 |
5.8 |
7.1 |
8.6 |
12.2 |
16.0 |
19.1 |
19.5 |
17.0 |
12.8 |
8.4 |
6.0 |
11.7 |
Maximum temperature (°C) |
13.3 |
14.6 |
16.4 |
18.2 |
21.5 |
25.1 |
28.4 |
28.7 |
25.8 |
21.5 |
16.7 |
14.1 |
18.7 |
Average temperature (°C) |
9.1 |
10.2 |
11.7 |
13.4 |
16.9 |
20.6 |
23.8 |
24.1 |
21.4 |
17.2 |
12.6 |
10.1 |
16.2 |
Precipitation (mm) |
45.0 |
34.0 |
42.0 |
46.0 |
51.0 |
42.0 |
23.0 |
55.0 |
72.0 |
83.0 |
54.0 |
52.0 |
599.0 |
Barcelona is located in a dry area that suffers extremely high water stress and low-medium drought risk. It has also a low probability of fire risk with an Active Fires Frequency of 0.075 fires per year between 2003-2021. In the Llobregat delta floodings are expected with a return period of 25, 100 and 250 years. They are not expected to directly affect the city of Barcelona, but they might affect critical infrastructures at the south-west of the town, such as main roads, railways and the airport.
No landslides are expected at the location of the Amphos 21 office in Barcelona. Located in a low-lying plain area in the Spanish coast, Barcelona and the surrounding areas might be affected by coastal floodings in the future.
As the rest of the Iberic Peninsula, Barcelona is not subjected to earthquakes of relevant intensity. Also, cyclones are not expected to affect the city.
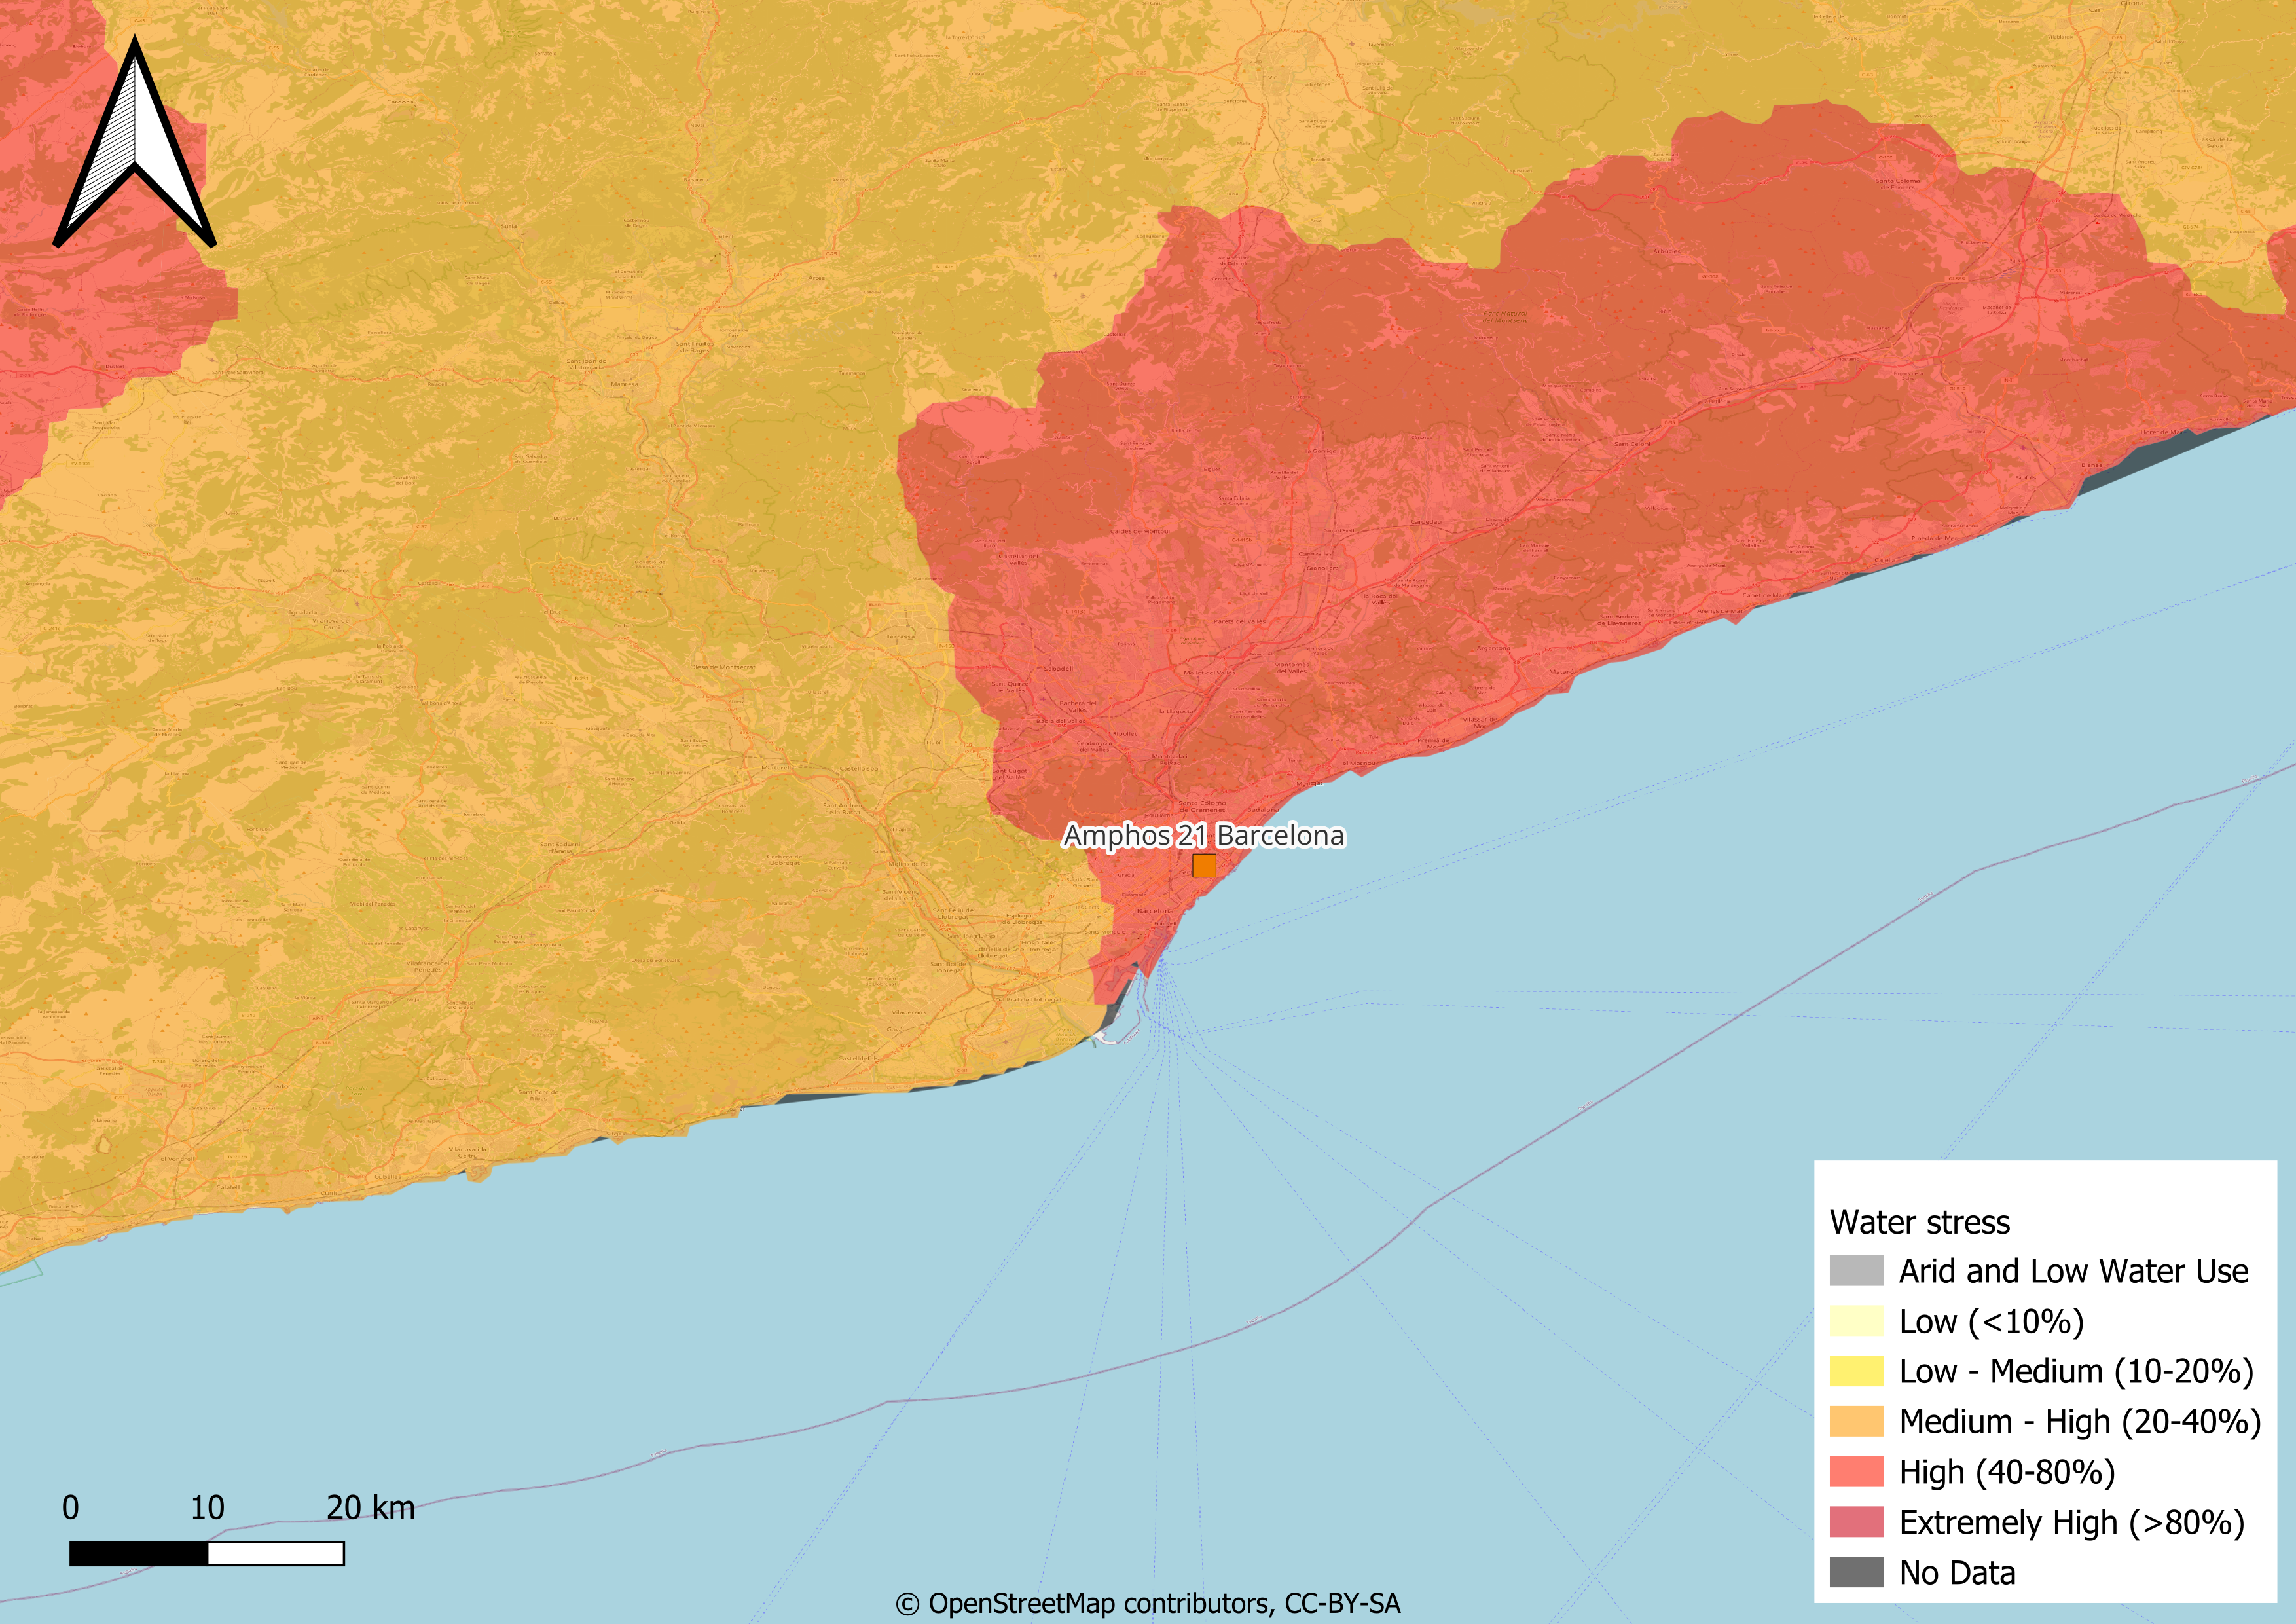
Fig. 5 Present-day water stress in Barcelona. Source: Aqueduct.
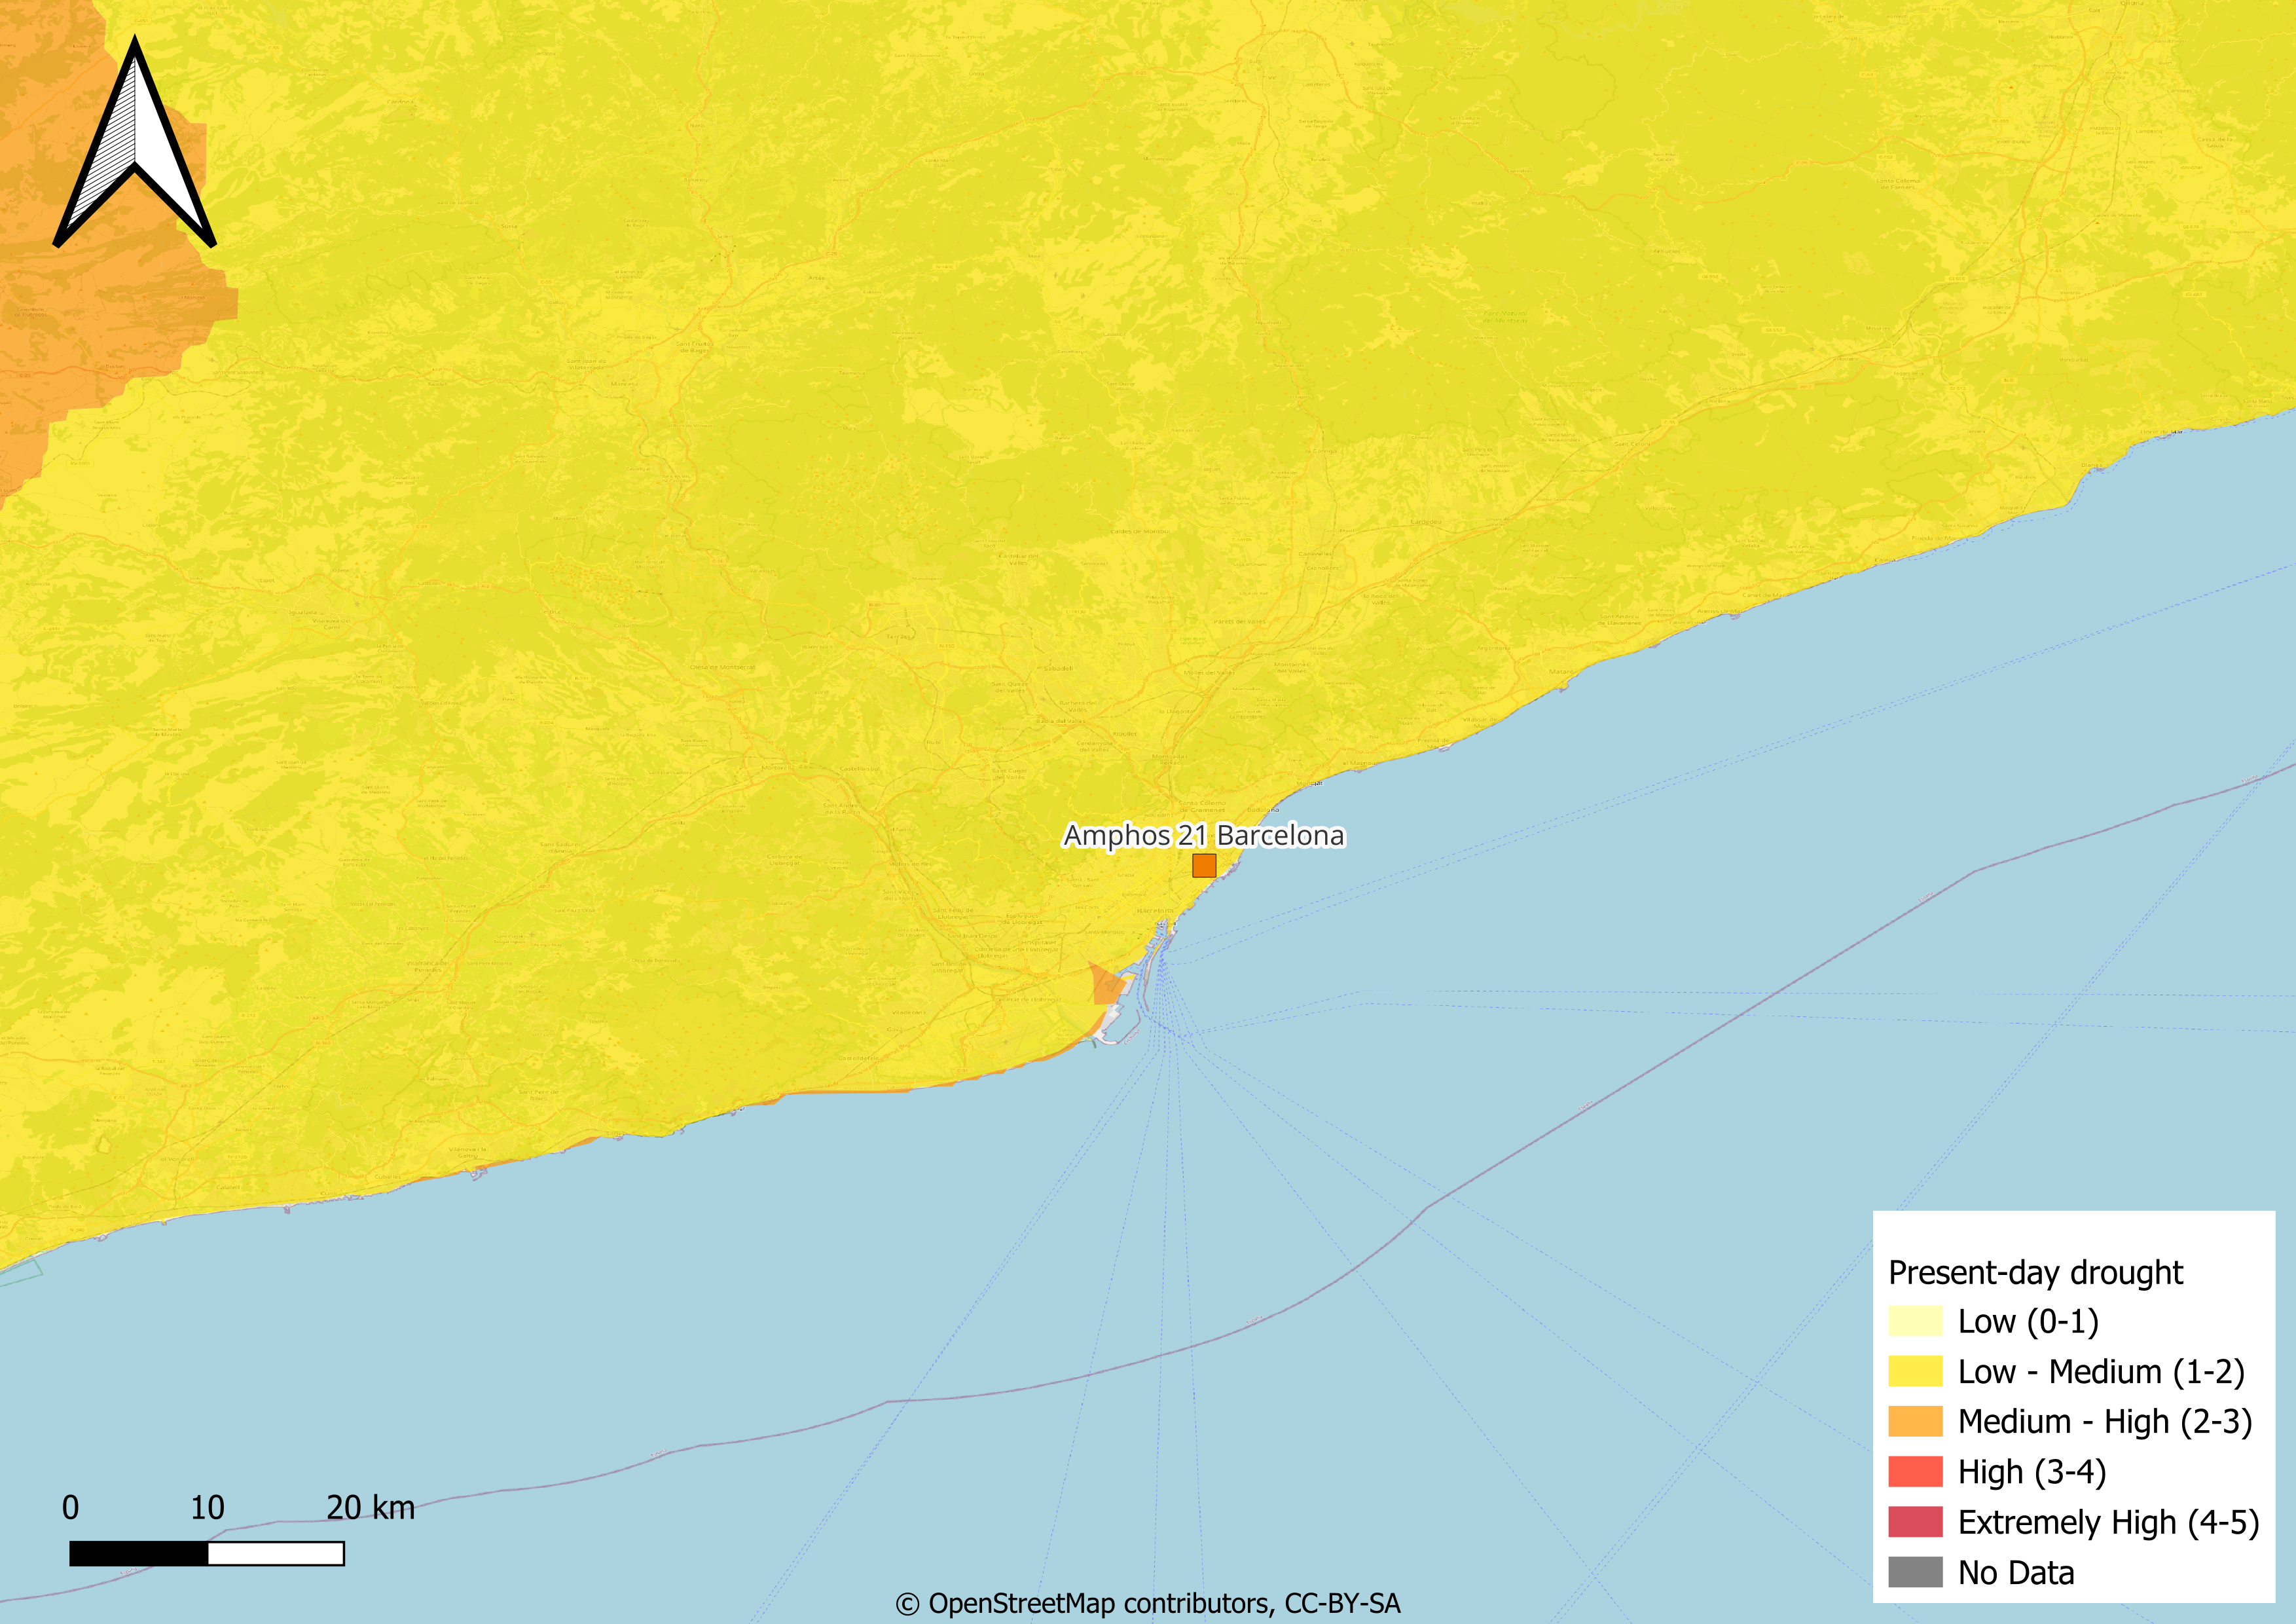
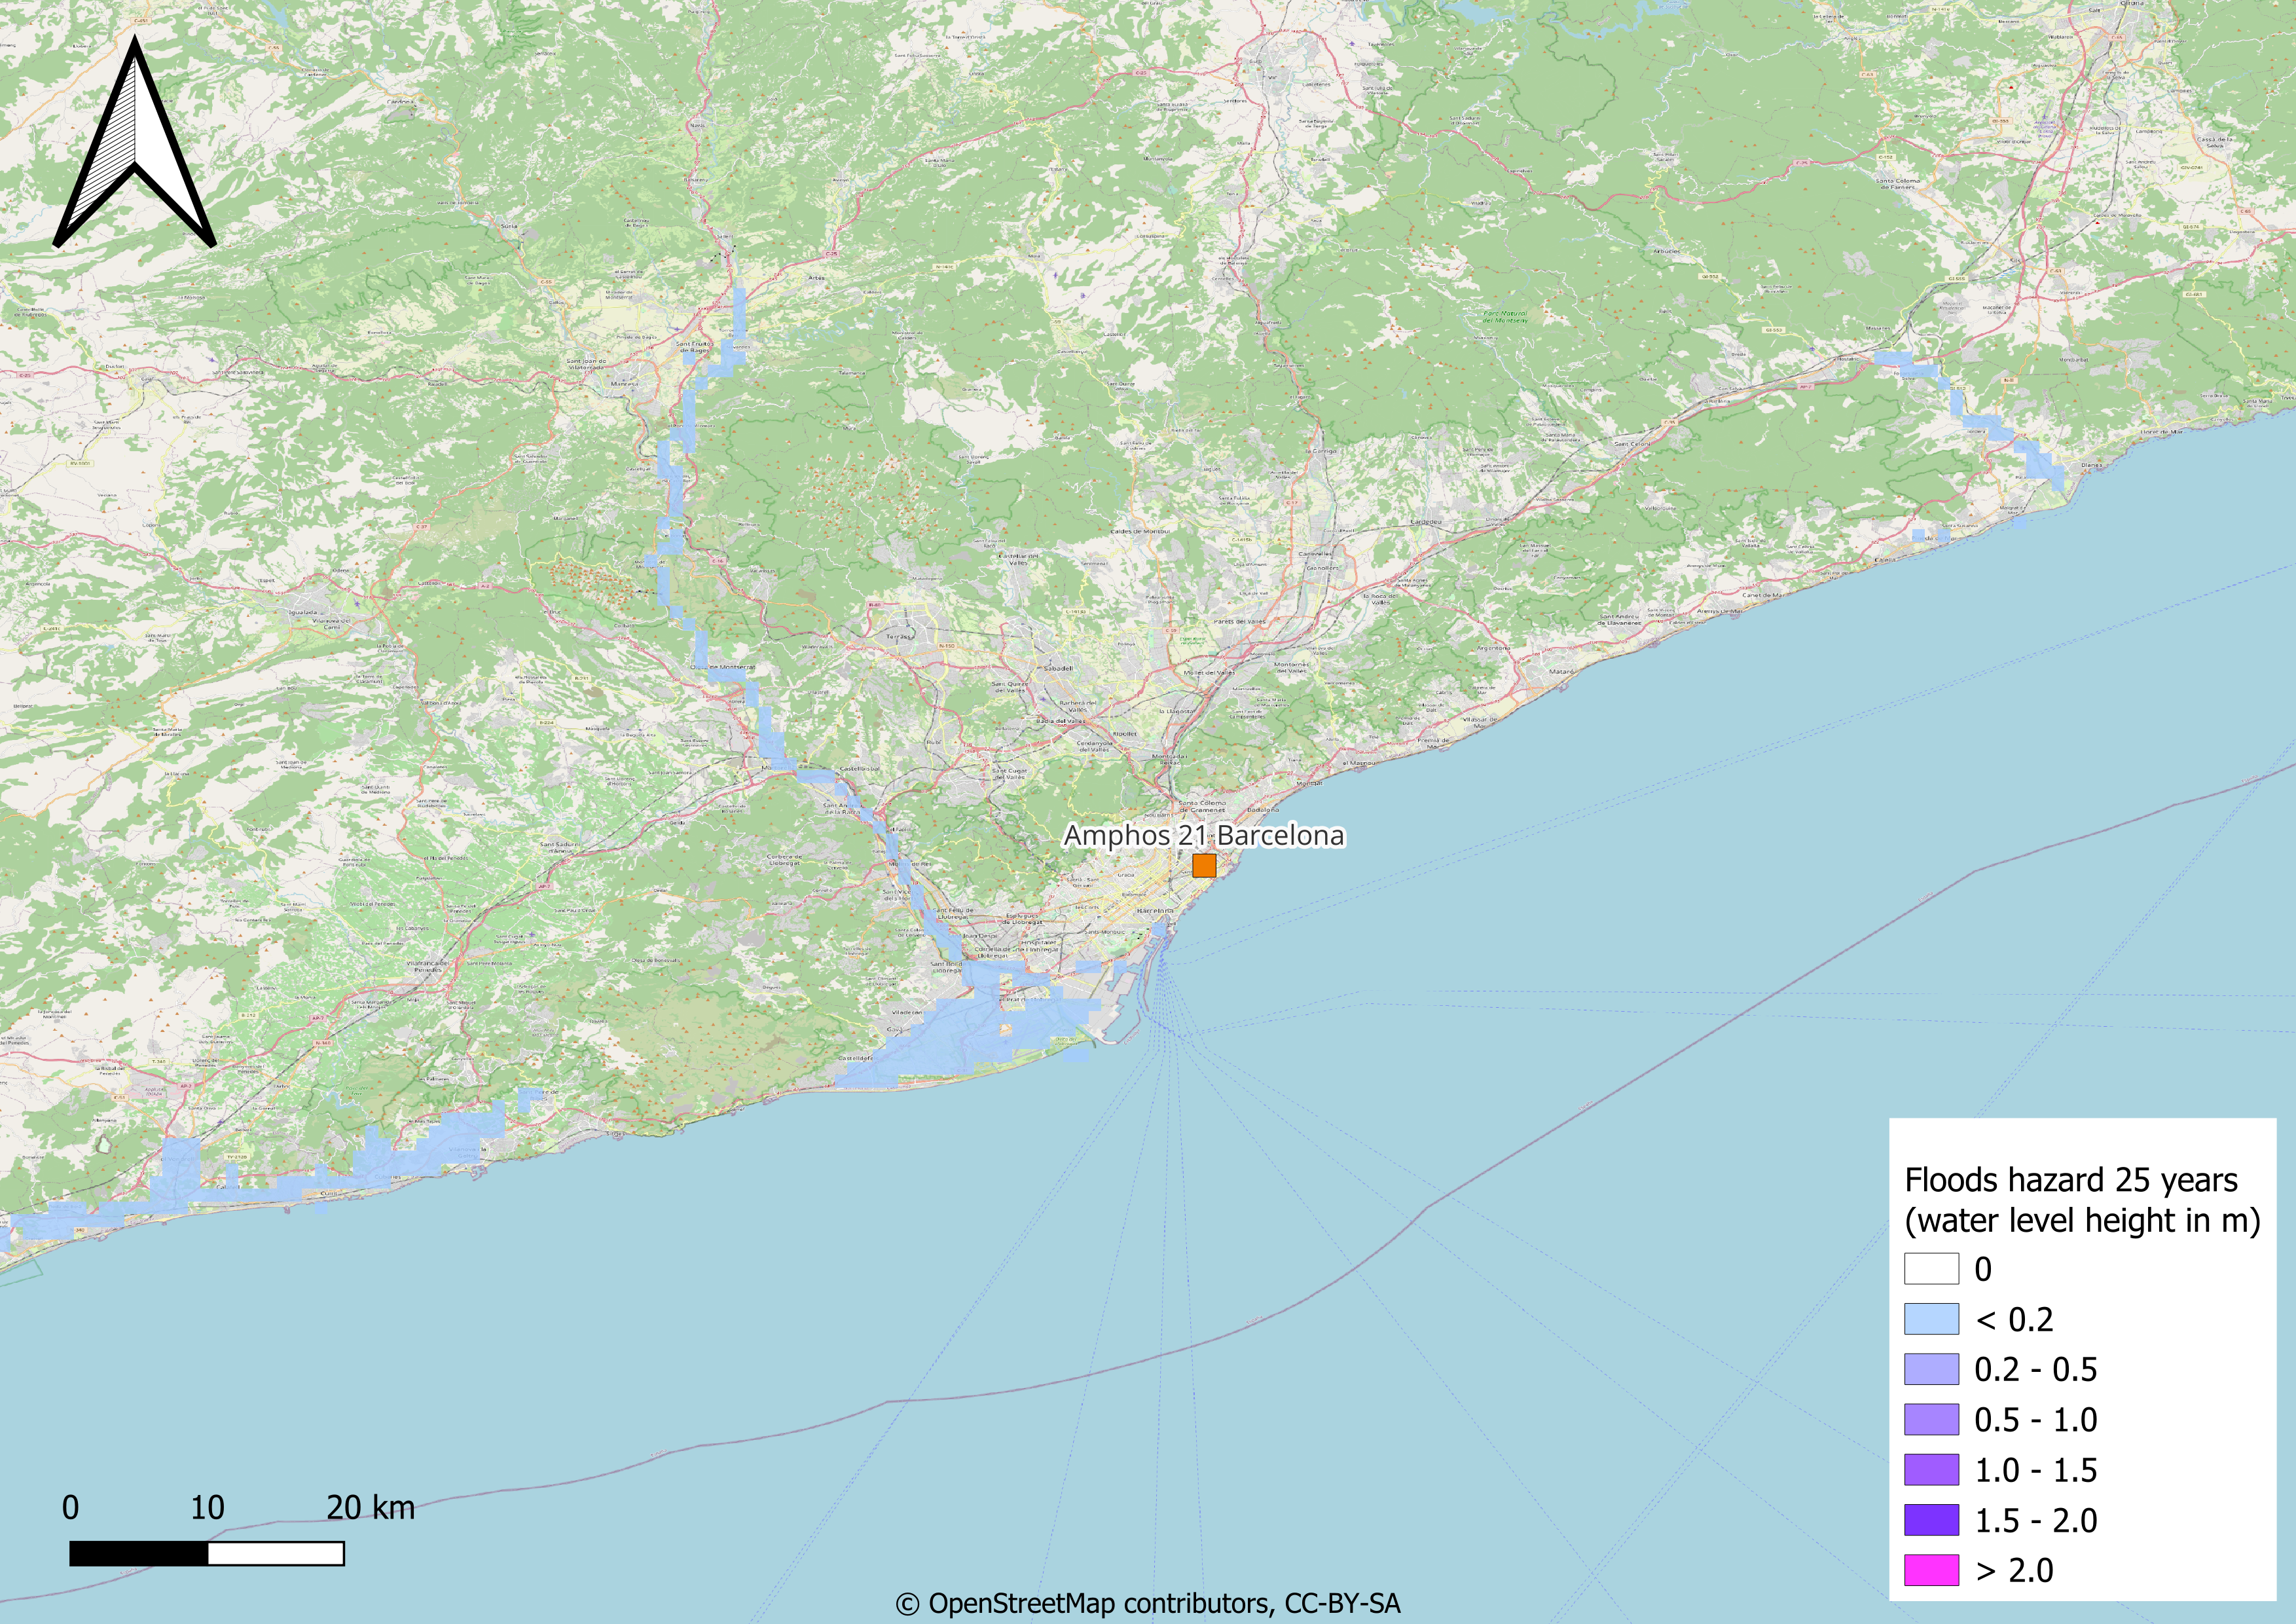
Fig. 7 Present-day flood hazard in a 25 years return period in Barcelona. The values are expected water level high in meters. The return period indicates that the flood of this magnitude is expected once every 25 years. Source: WRI - Aqueduct Floods.
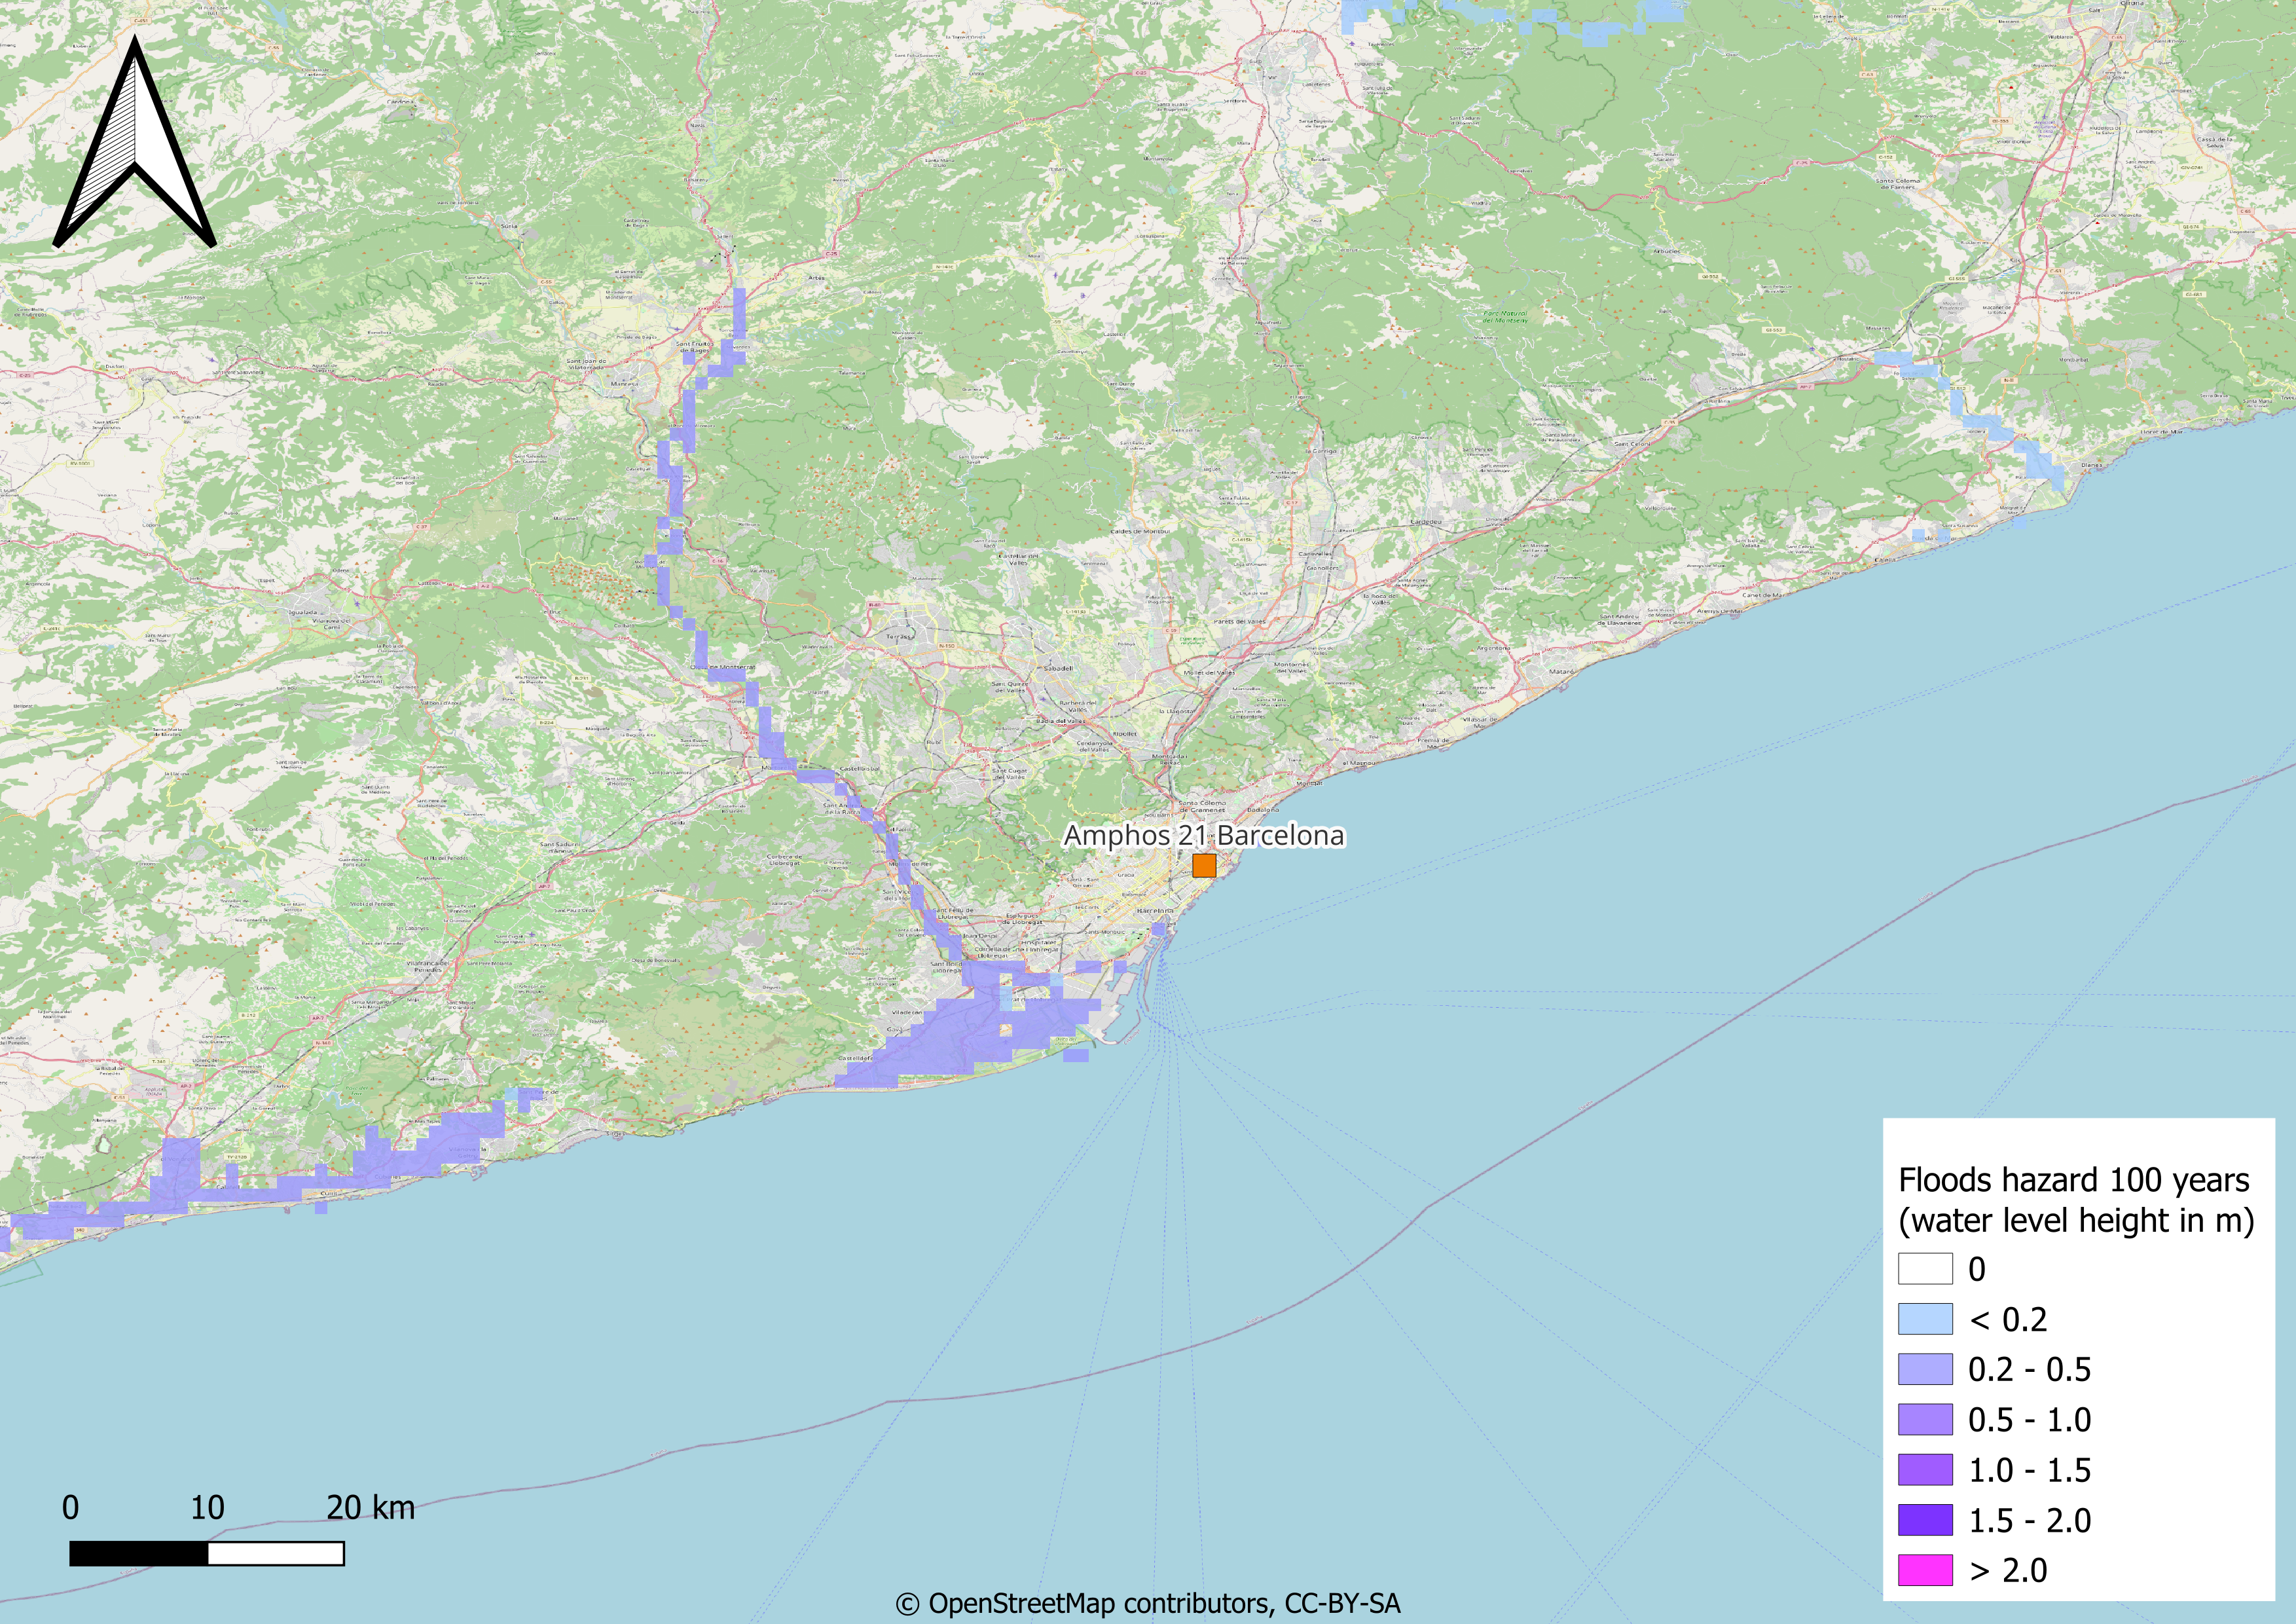
Fig. 8 Present-day flood hazard in a 100 years return period in Barcelona. The values are expected water level high in meters. The return period indicates that the flood of this magnitude is expected once every 100 years. Source: WRI - Aqueduct Floods.
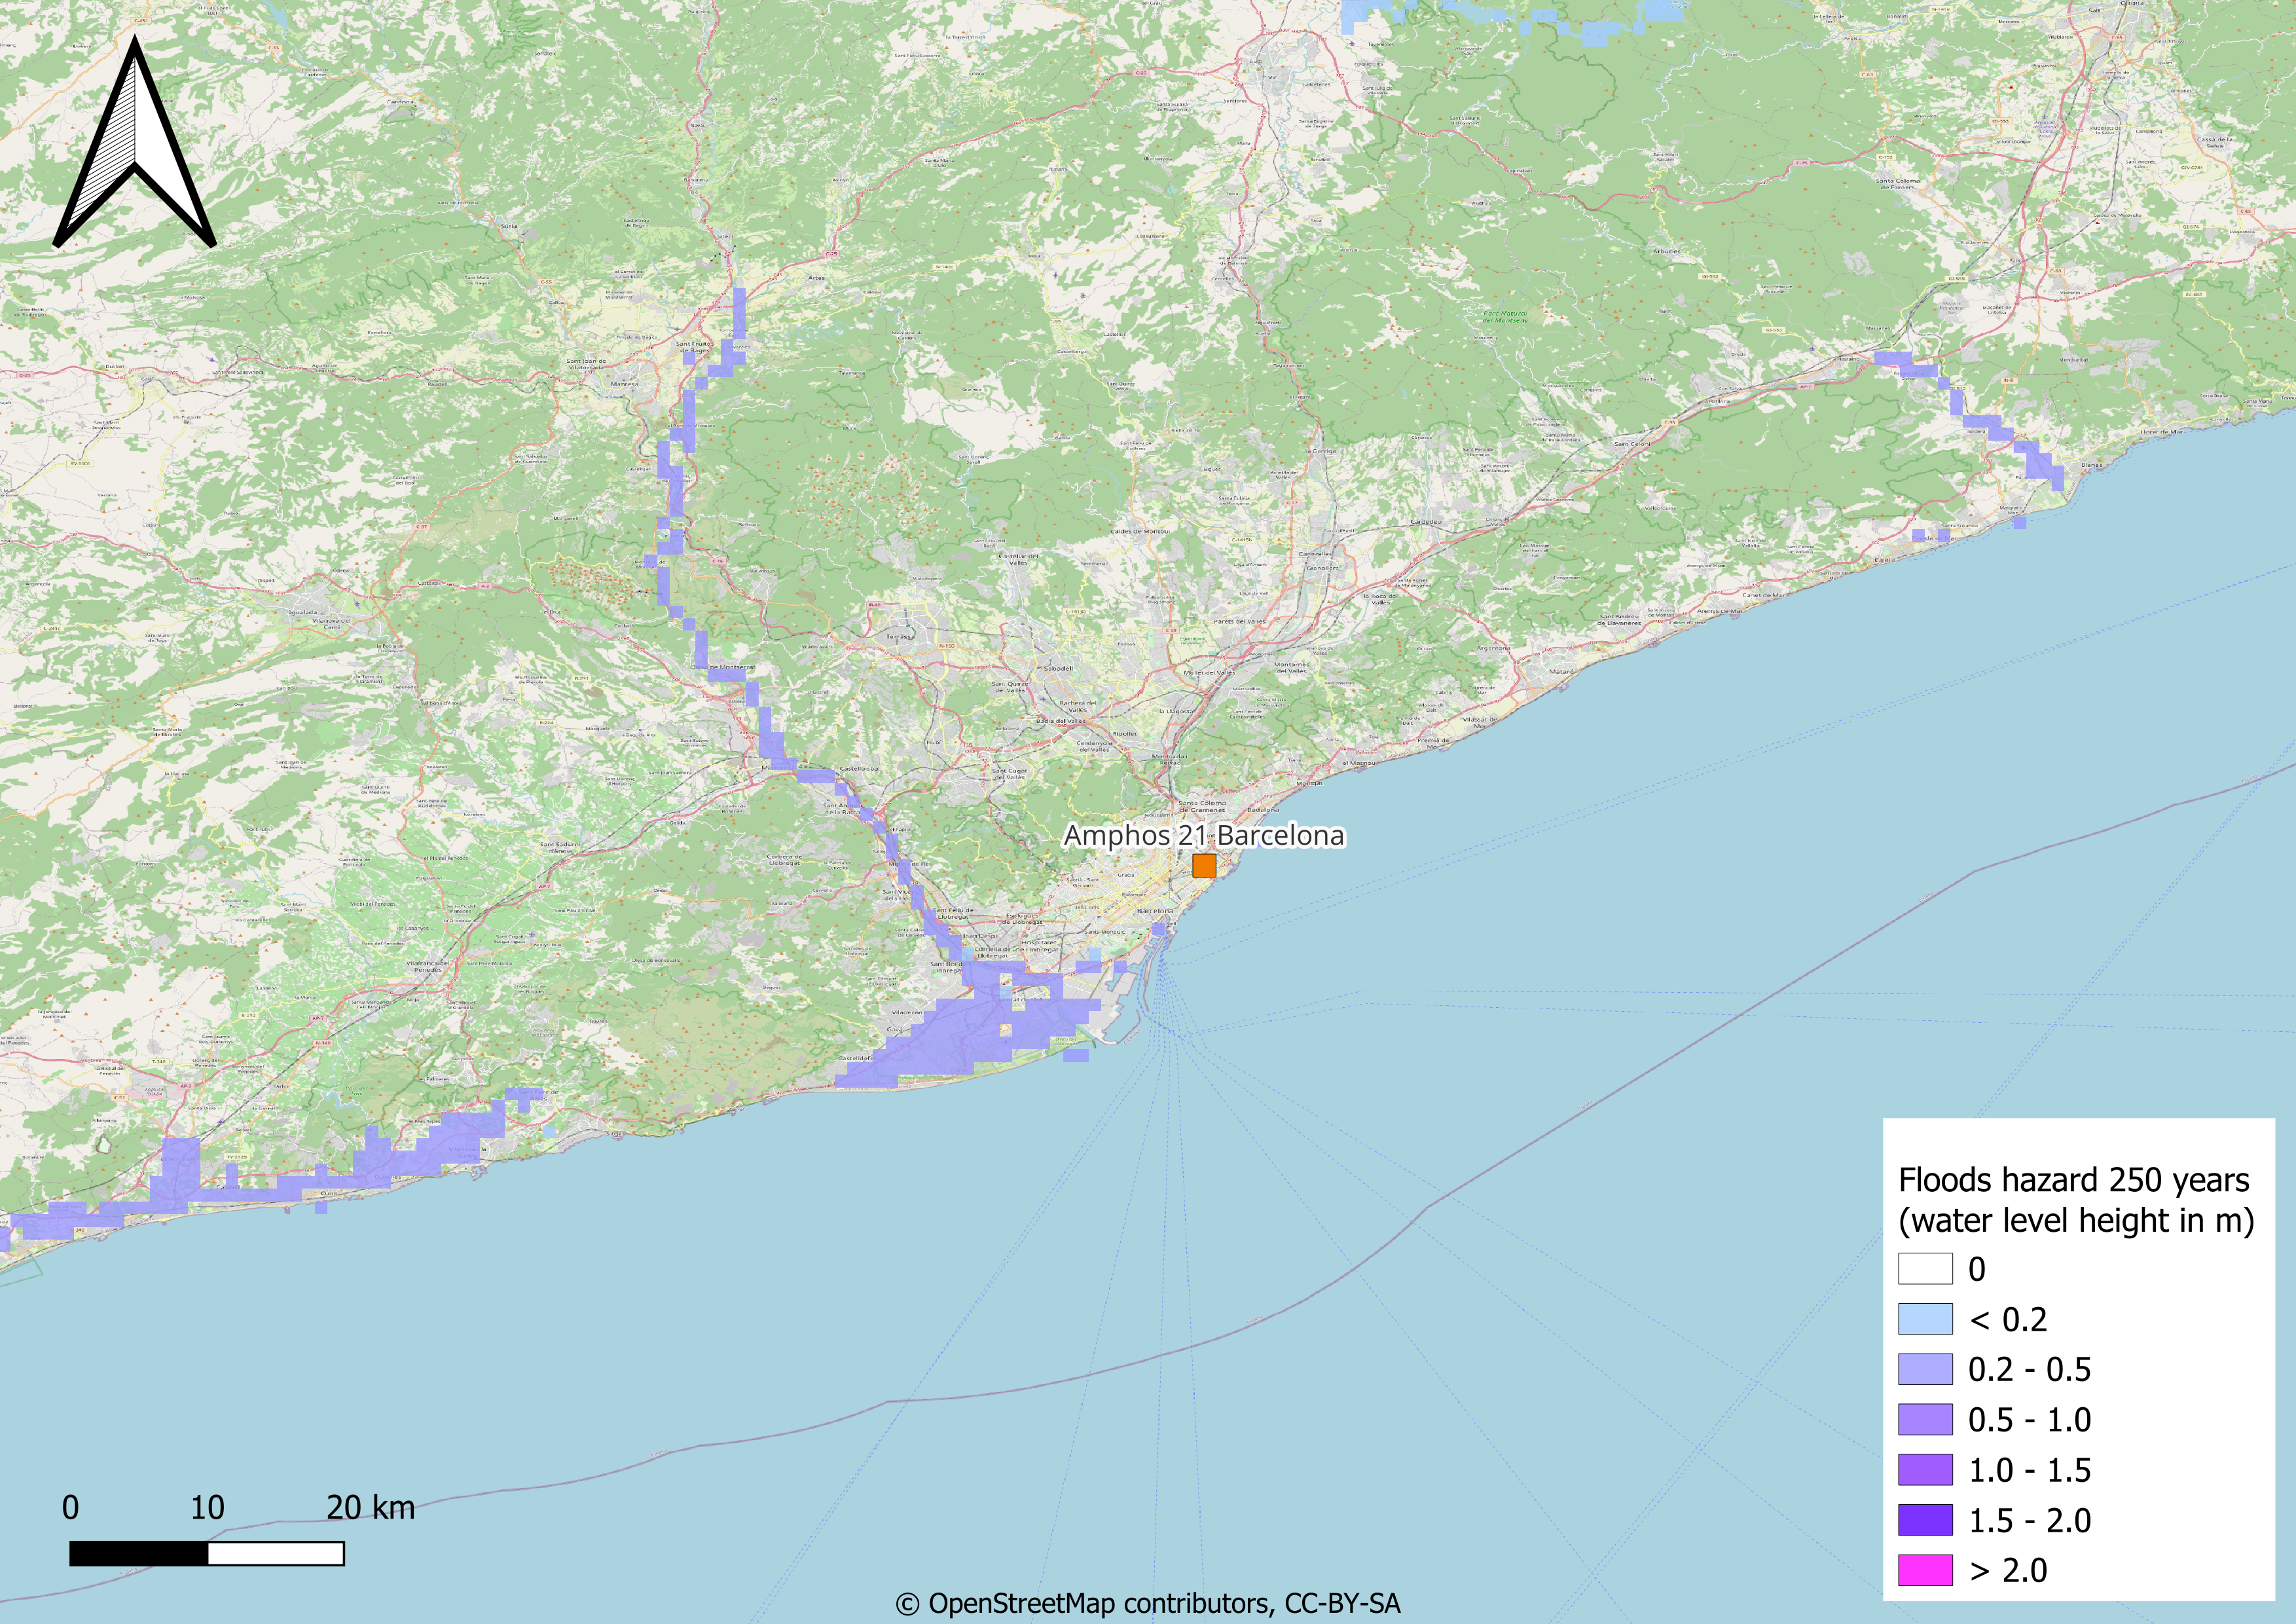
Fig. 9 Present-day flood hazard in a 250 years return period in Barcelona. The values are expected water level high in meters. The return period indicates that the flood of this magnitude is expected once every 250 years. Source: WRI - Aqueduct Floods.
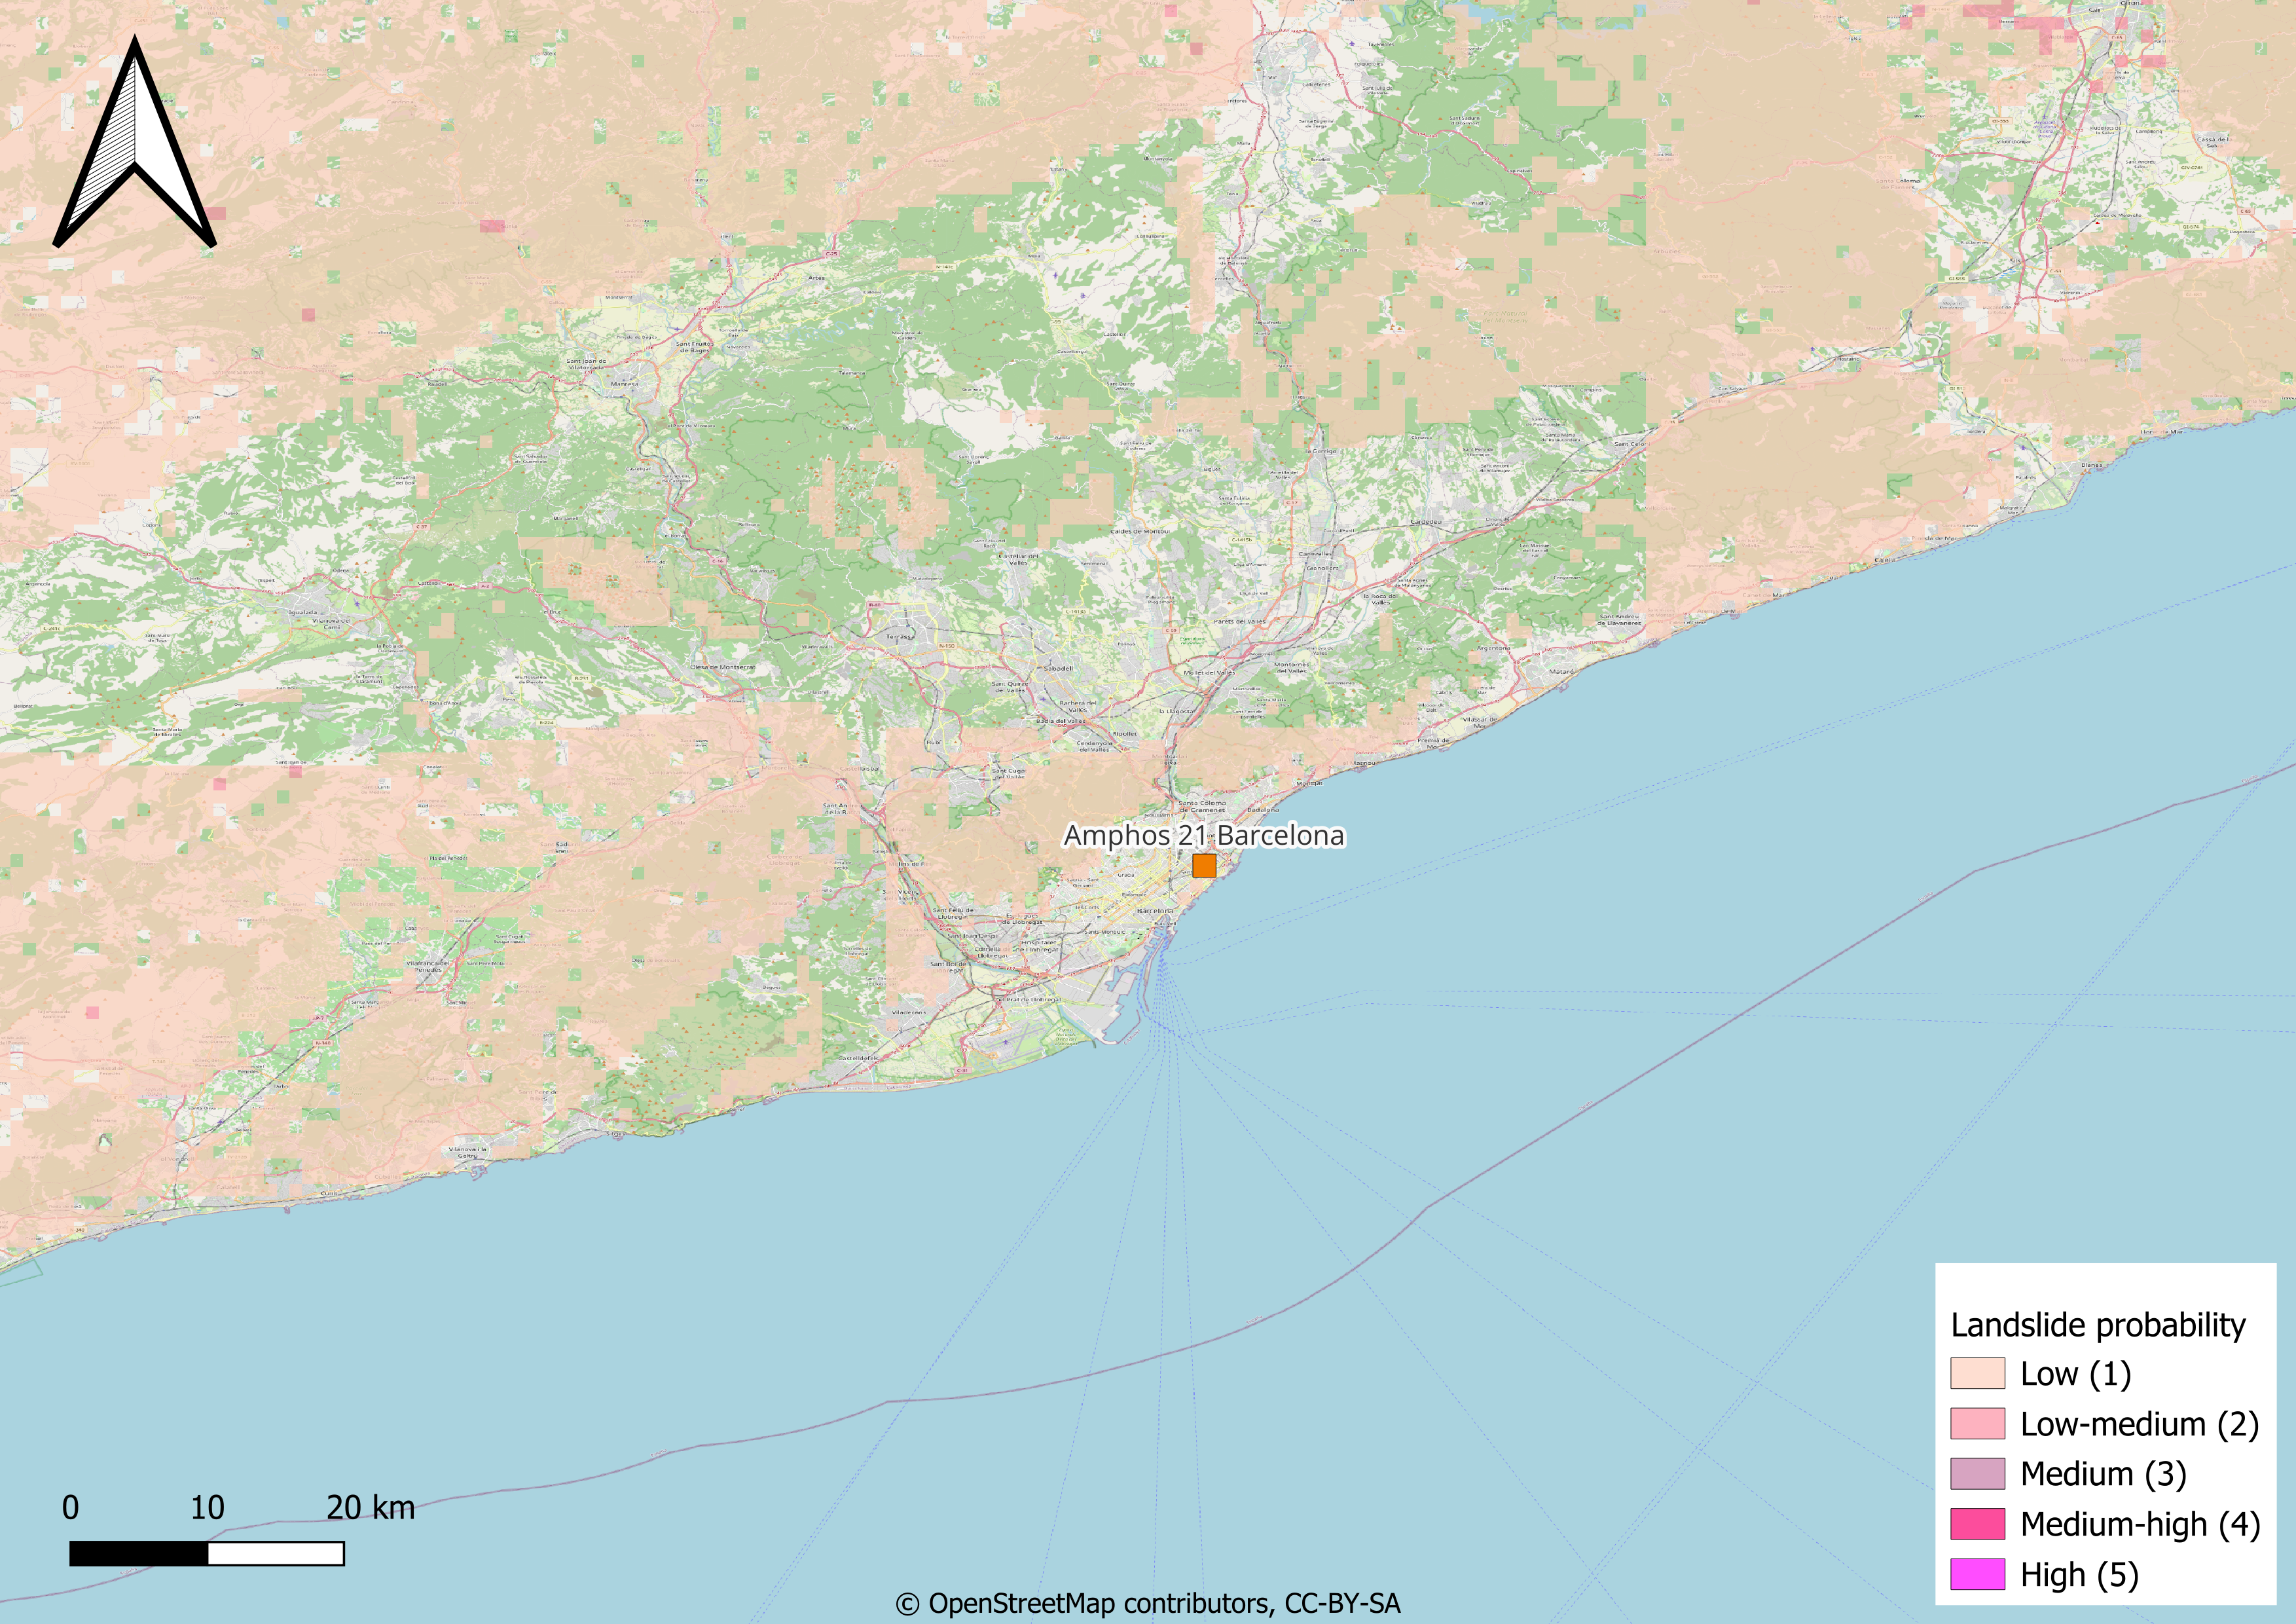
Fig. 10 Present-day frequency of landslides triggered by precipitation meassured in expected annual probability and percentage of pixel of occurrence of a potentially destructive landslide event x 1000000. Source Global Assessment Report.
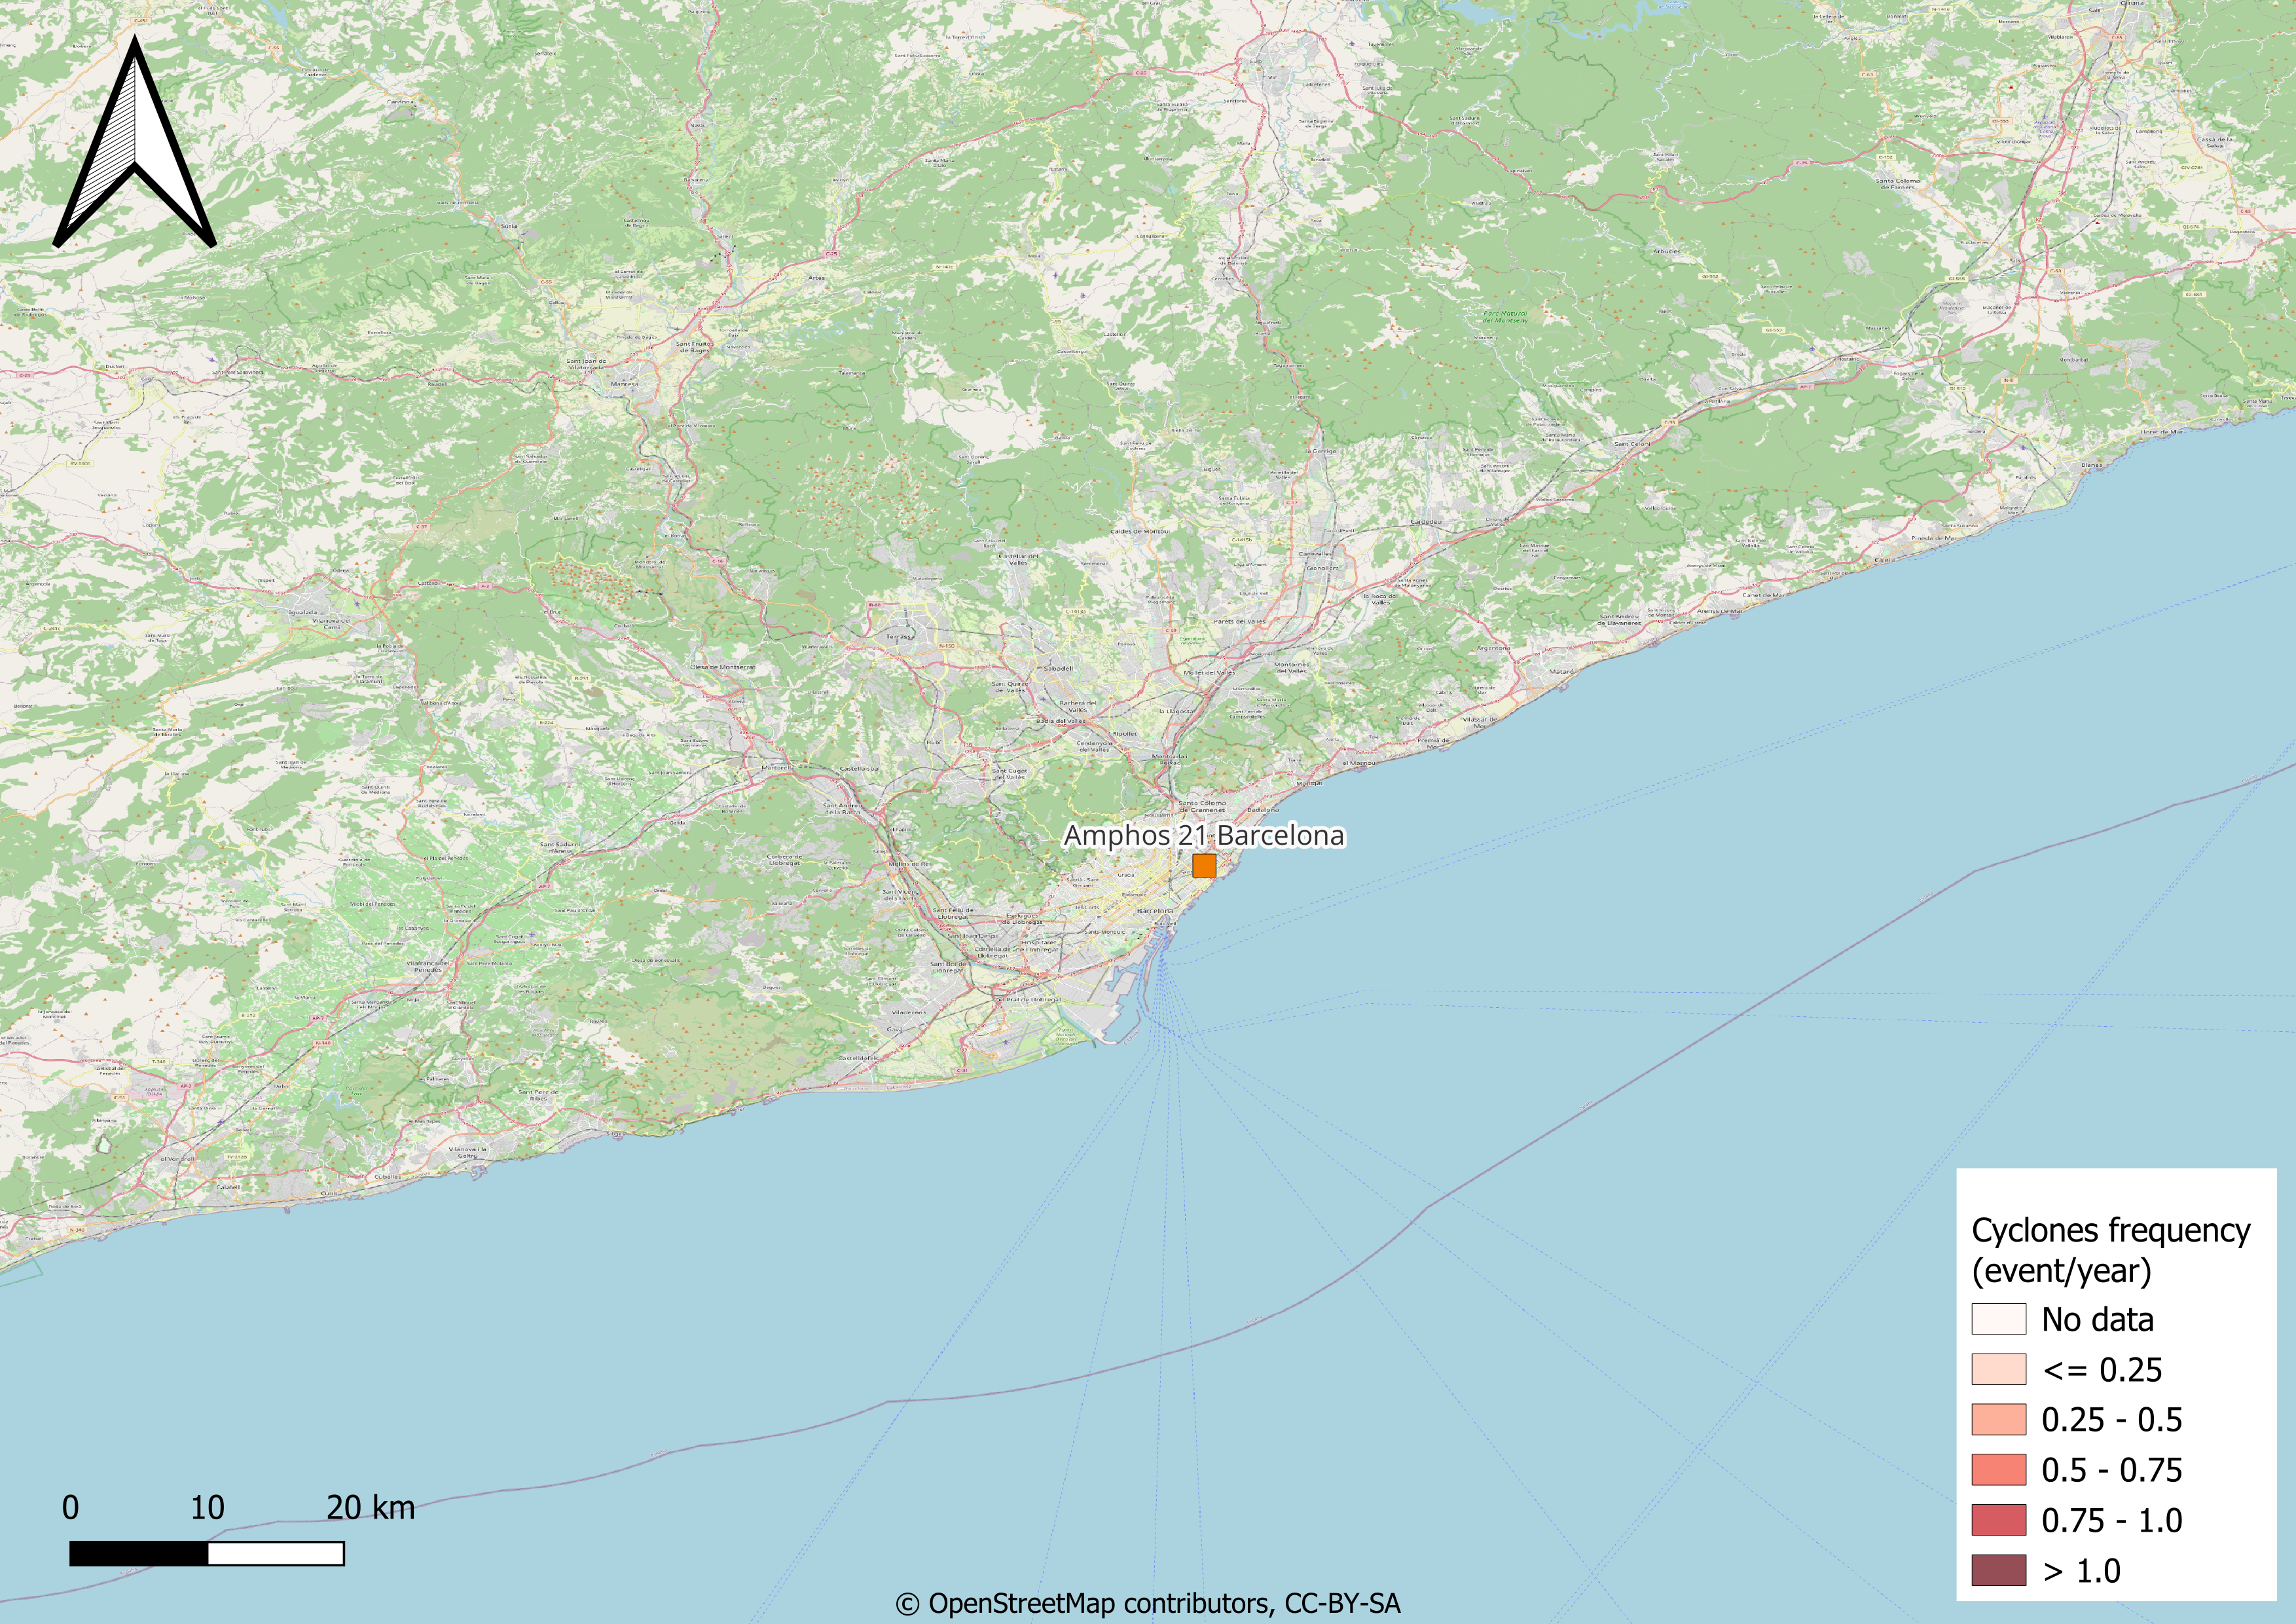
Fig. 11 Tropical cyclones frequency in events per year is an estimate of the tropical cyclone frequency of Saffir-Simpson category 5. Source: IBTrACS processed by UNEP/GRID-Geneva.
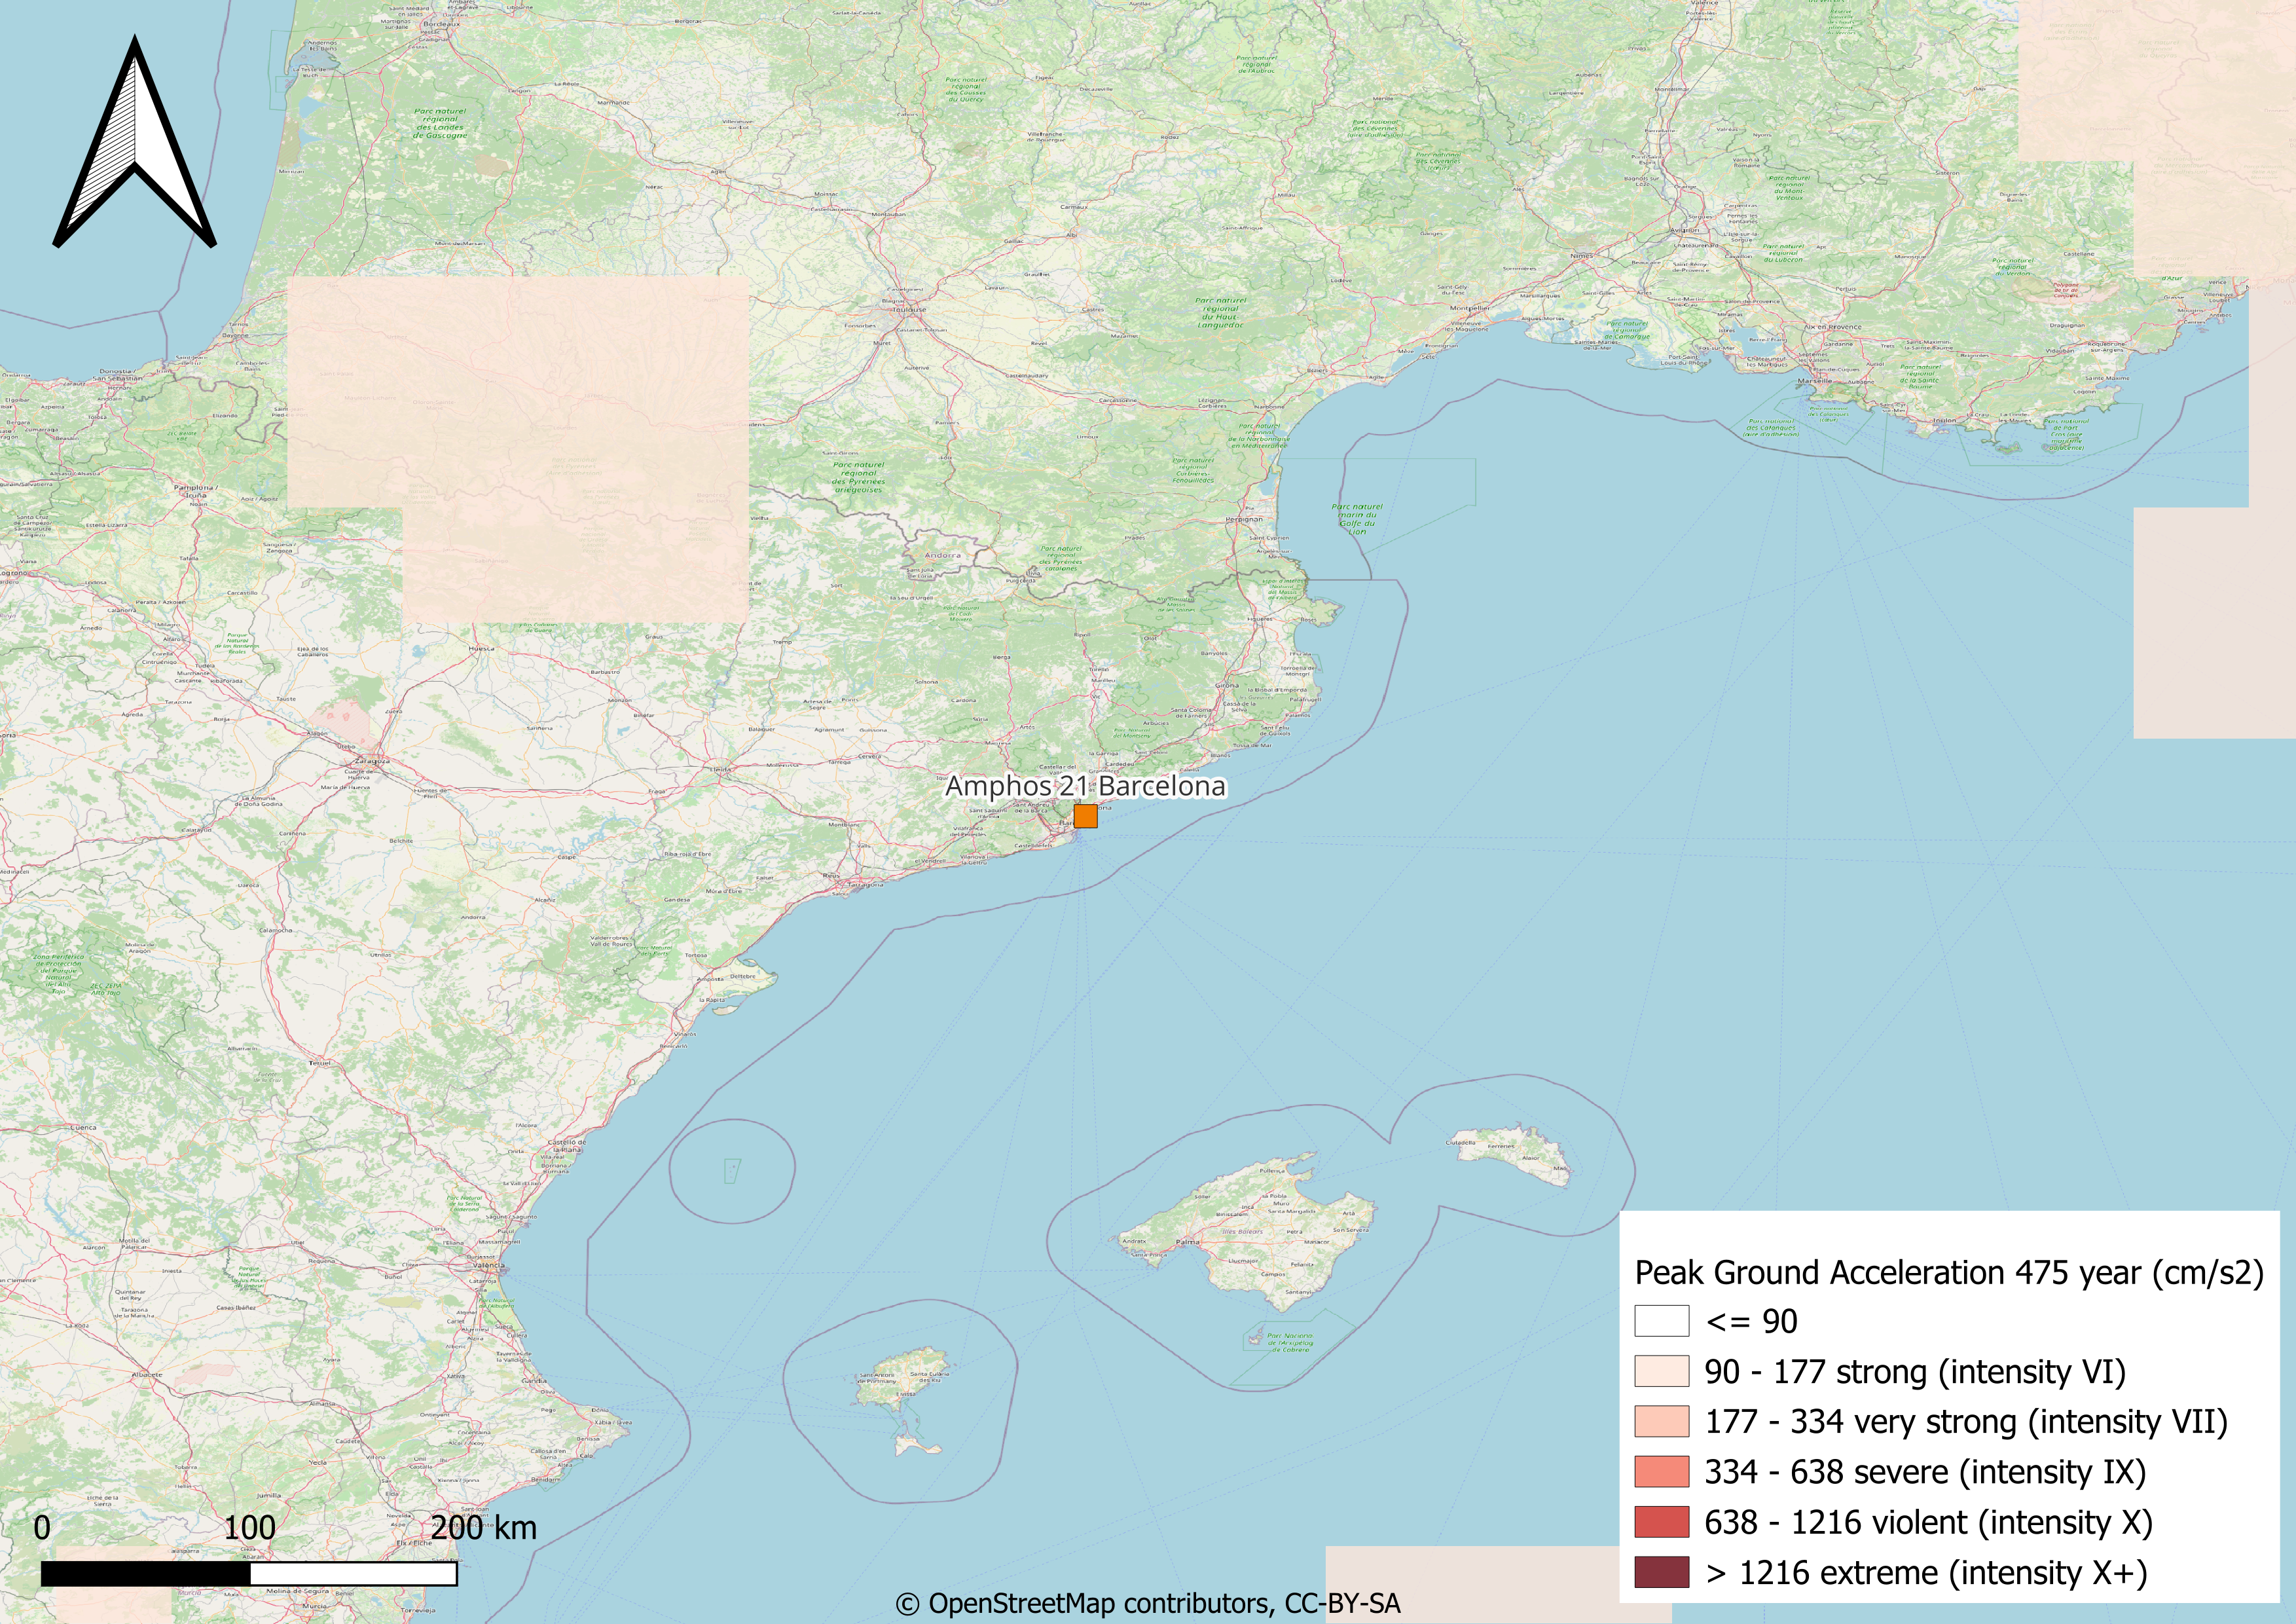
Fig. 12 Estimated Peak Ground Acceleration (PGA) (cm/s2) in a 475 years retorn period earthquake in Barcelona.
Projected Hazards
The baseline and projected future averaged value of each CID analyzed for this site is presented in the following table. The future projected values for years 2030 and 2050 are displayed for scenario RCP2.6 (green path) and RCP8.5 (unrestricted growth). The temporal evolution of the CID and the mean value for each time period are displayed by clicking on the CID name. Each climate-related hazard is evaluated in a specific section.
Climate Impact-Driver (chart link) |
Units |
Historical |
2030 | 2.6 |
2030 | 8.5 |
2050 | 2.6 |
2050 | 8.5 |
Source |
|---|---|---|---|---|---|---|---|
[-] |
1.0 |
1.0 |
1.0 |
1.0 |
1.0 |
||
days |
33.8 |
32.3 |
36.2 |
37.7 |
37.4 |
||
days |
5.7 |
5.5 |
5.9 |
5.7 |
5.4 |
||
°C |
17.9 |
19.4 |
19.9 |
20.1 |
21.2 |
||
°C |
18.7 |
20.2 |
20.7 |
20.8 |
22.0 |
||
°C |
10.7 |
12.0 |
12.4 |
12.5 |
13.5 |
||
°C |
11.7 |
13.0 |
13.4 |
13.4 |
14.5 |
||
°C |
7.2 |
7.4 |
7.5 |
7.6 |
7.7 |
||
mm yr-1 |
685.2 |
711.8 |
703.7 |
706.7 |
692.1 |
||
days |
4.2 |
2.0 |
1.9 |
0.7 |
0.6 |
||
days |
351.5 |
358.6 |
356.3 |
358.1 |
359.7 |
||
days |
21.5 |
23.3 |
20.8 |
19.8 |
19.9 |
||
days |
0.0 |
0.1 |
0.0 |
0.0 |
0.0 |
||
mm |
77.8 |
70.8 |
95.9 |
75.0 |
79.9 |
||
mm |
112.6 |
119.2 |
133.7 |
112.8 |
127.4 |
||
°C |
32.7 |
35.2 |
35.4 |
35.8 |
37.0 |
||
°C |
20.5 |
22.3 |
22.5 |
22.6 |
23.5 |
||
°C |
4.0 |
4.9 |
5.5 |
5.7 |
6.7 |
||
°C |
-1.6 |
-0.5 |
-0.4 |
0.5 |
1.2 |
||
°C |
14.4 |
15.8 |
16.2 |
16.3 |
17.4 |
||
°C |
16.2 |
17.6 |
18.0 |
18.1 |
19.2 |
||
m s-1 |
2.4 |
2.4 |
2.4 |
2.4 |
2.4 |
||
days |
77.0 |
74.3 |
72.6 |
69.7 |
66.8 |
||
mm yr-1 |
767.8 |
792.1 |
751.0 |
704.5 |
722.1 |
||
mm yr-1 |
599.0 |
618.0 |
585.9 |
549.6 |
563.4 |
||
mm d-1 |
9.4 |
10.1 |
9.8 |
9.5 |
10.2 |
||
days |
74.4 |
96.0 |
103.8 |
105.5 |
118.7 |
||
mm |
729.4 |
753.5 |
713.5 |
668.0 |
685.8 |
||
mm |
569.1 |
587.9 |
556.6 |
521.1 |
535.1 |
||
days |
3.9 |
25.5 |
37.3 |
30.1 |
65.7 |
||
days |
9.5 |
10.2 |
8.3 |
8.3 |
9.0 |
CIDs with the (bc) suffix correspond to the biased corrected variables. The bias factors and corrections applied are described in the next table. The climate model present a good correlation with the actual precipitation, however it underestimates the actual temperature at the site.
Climate Impact-Driver |
Modelled |
Observed |
Deviation |
Factor |
Delta |
|---|---|---|---|---|---|
Daily maximum near surface air temperature |
17.92 |
18.70 |
-4.19 % |
0.78 °C |
|
Daily minimum near surface air temperature |
10.74 |
11.70 |
-8.20 % |
0.96 °C |
|
Near surface air temperature |
14.38 |
16.20 |
-11.23 % |
1.82 °C |
|
Precipitation |
767.79 |
599.00 |
28.18 % |
0.78 [-] |
Mean temperature
By 2030, temperatures are projected to increase by 8-11%, while by 2050 they might increase up to 18%.
Climate Impact-Driver (chart link) |
Historical |
2030 | 2.6 change |
2030 | 8.5 change |
2050 | 2.6 change |
2050 | 8.5 change |
Source |
|---|---|---|---|---|---|---|
16.2 °C |
Increase |
Large Increase |
Large Increase |
Large Increase |
Extreme Heat
CIDs associated with extreme heat events are projected to increase largely for both time periods and scenarios except for the daily maximum air temperature in RCP2.6 by 2030, which is expected to increase. Considering the current frequency of heatwaves and the increase in tropical nights and summer days, it is projected that extreme heat events hazards will be more frequent in the future. By 2050, in the best-case scenarios, average temperatures in Barcelona will increase from 18.5 ºC to 21 ºC, while in the worst-case average temperatures might reach 22 ºC. By 2050, the number of summer days (when maximum temperatures exceeds 35 ºC) are expected to increase from 75 to 120 days per year. As for tropical nights (when minimum temperature exceeds 20 ºC), by 2050 they might increase from 4 to more than 60 per year.
Climate Impact-Driver (chart link) |
Historical |
2030 | 2.6 - impact on hazard |
2030 | 8.5 - impact on hazard |
2050 | 2.6 - impact on hazard |
2050 | 8.5 - impact on hazard |
Source |
|---|---|---|---|---|---|---|
18.7 °C |
Increase |
Large Increase |
Large Increase |
Large Increase |
||
74.4 days |
Large Increase |
Large Increase |
Large Increase |
Large Increase |
||
3.9 days |
Large Increase |
Large Increase |
Large Increase |
Large Increase |
Cold spells and frosts
Barcelona is characterized by a mild climate and is thus not affected by frequent cold spells and frosts. In the future, this events are expected to largely decrease under both scenarios and for both periods of time.
Climate Impact-Driver (chart link) |
Historical |
2030 | 2.6 - impact on hazard |
2030 | 8.5 - impact on hazard |
2050 | 2.6 - impact on hazard |
2050 | 8.5 - impact on hazard |
Source |
|---|---|---|---|---|---|---|
4.2 days |
Large Decrease |
Large Decrease |
Large Decrease |
Large Decrease |
||
0.0 days |
Large Increase |
Large Decrease |
Large Decrease |
Large Decrease |
Mean precipitation
The mean precipitations in Barcelona are not expected to vary significantly in the mid-term. In the long-term, precipitatoins might decrease by 7 %.
Climate Impact-Driver (chart link) |
Historical |
2030 | 2.6 change |
2030 | 8.5 change |
2050 | 2.6 change |
2050 | 8.5 change |
Source |
|---|---|---|---|---|---|---|
599.0 mm yr-1 |
No Change |
No Change |
Decrease |
Decrease |
Floods and landslides
The future projections for floods and landslides are not marked by a significant increase. Nonetheless, under the RCP8.5 scenario these hazards are expected to increase. Heavy and very heavy precipitation days (when daily precipitations exceed, respectively, 10mm and 20mm) are expected to decrease in the future. On the other side, maximum 1-day precipitations are expected to increase, meaning that the accumulated rainfall in 1 day will be higher. At the sime time, maximum 5-days precipitations are expected to increase largely. Intense rainfalls might lead to floodings of the Llobregat river or cause landslides in the mountain areas, potentially damaging critical infrastructure such as roads or the airport. Also, intense rainfalls might cause an accumulation of water within the city, affecting urban transportation and causing delays or damages to civil and electric infrastructure.
Climate Impact-Driver (chart link) |
Historical |
2030 | 2.6 - impact on hazard |
2030 | 8.5 - impact on hazard |
2050 | 2.6 - impact on hazard |
2050 | 8.5 - impact on hazard |
Source |
|---|---|---|---|---|---|---|
21.5 days |
Increase |
No Change |
Decrease |
Decrease |
||
77.8 mm |
Decrease |
Large Increase |
No Change |
No Change |
||
112.6 mm |
Increase |
Large Increase |
No Change |
Large Increase |
||
9.5 days |
Increase |
Large Decrease |
Large Decrease |
No Change |
Aridity
The aridity in Barcelona is projected not to change significantly in the mid-term and to increase largely in the long-term. This has the potential to exacerbate the already extremely high water stress of the area. The number of consecutive dry days increases in the short term and increases largely in the long term. The aridity index (representing the evapotranspiration divided by the precipitation) is projected to increase under the RCP8.5 scenario for both periods of time. On the other side, under the RCP2.6 scenario this CID in not expected to vary in the mid-term and to increase largely in the long-term.
Climate Impact-Driver (chart link) |
Historical |
2030 | 2.6 - impact on hazard |
2030 | 8.5 - impact on hazard |
2050 | 2.6 - impact on hazard |
2050 | 8.5 - impact on hazard |
Source |
|---|---|---|---|---|---|---|
1.0 [-] |
No Change |
Increase |
Large Increase |
Increase |
||
33.8 days |
No Change |
Increase |
Large Increase |
Large Increase |
Drought
Similar to aridity, the drought hazard is projected to increase for both time periods and scenarios. In particular, in the long-term a large increase in this climate hazard is expected. The number of consecutive days without precipitation increases in the mid-term and it increases largely in the long-term, and the number of wet days decreases for all scenarios but the RCP8.5 in the long-term, when this CID is projected to decrease largely.
Climate Impact-Driver (chart link) |
Historical |
2030 | 2.6 - impact on hazard |
2030 | 8.5 - impact on hazard |
2050 | 2.6 - impact on hazard |
2050 | 8.5 - impact on hazard |
Source |
|---|---|---|---|---|---|---|
33.8 days |
No Change |
Increase |
Large Increase |
Large Increase |
||
77.0 days |
No Change |
Increase |
Increase |
Large Increase |
Wildfire
Amphos 21 office is located within the city of Barcelona, thus wildfires do not affect directly the facility. Nonetheless, wildfires are a known issue in Catalonia and every year they affect the internal regions, causing losses and damages. Under all scenarios, this hazard is expected to increase, driven by an increase in the number of consecutive dry days and a decrease in the number of wet days. On the other side, the speed of wind is not expected to vary significantly.
Climate Impact-Driver (chart link) |
Historical |
2030 | 2.6 - impact on hazard |
2030 | 8.5 - impact on hazard |
2050 | 2.6 - impact on hazard |
2050 | 8.5 - impact on hazard |
Source |
|---|---|---|---|---|---|---|
33.8 days |
No Change |
Increase |
Large Increase |
Large Increase |
||
2.4 m s-1 |
No Change |
No Change |
No Change |
No Change |
||
77.0 days |
No Change |
Increase |
Increase |
Large Increase |
Coastal flood
Located at an altitude of 6m above sea level, Amphos 21 office in Barcelona is potentially exposed to coastal flooding. The sea level in the area is projected to increase by 0.15m by 2030 and 0.25m by 2050, potentially affecting critial infrastructure in the city and causing troubles to the company.
CID |
2030 | 2.6 |
2030 | 8.5 |
2050 | 2.6 |
2050 | 8.5 |
|---|---|---|---|---|
Relative sea level rise |
0.14 |
0.14 |
0.25 |
0.28 |
Conclusions
This section summarizes the climate-related physical hazards affecting Amphos 21 office in Barcelona. The projected future evolution of the hazards is graded between a decrease to a large increase in the hazard. Some of the hazards are non relevant for a site. In the case of Barcelona, cold spells and frosts hazards can be disregarded.
Barcelona is projected to suffer a large increase in mean temperatures and a slight decrease in mean precipitations. These variations lead to a large increase in potential physical risks associated with extreme heat events, aridity and drought, especially in the long-term (2050); and an increase on wildfire hazard.
Floods and landslides hazards present different projections depending on the scenario considered. The RCP2.6 scenario does not entail a significant change, while these hazards are expected to increase in the worst-case scenario (RCP8.5).
Non statistically conclusive variations are projected for hazards related to the wind.
Hazard |
2030 | 2.6 - Estimated Physical Risk Change |
2030 | 8.5 - Estimated Physical Risk Change |
2050 | 2.6 - Estimated Physical Risk Change |
2050 | 8.5 - Estimated Physical Risk Change |
|---|---|---|---|---|
Extreme heat |
Large Increase |
Large Increase |
Large Increase |
Large Increase |
Cold spell and frost |
No Relevant |
No Relevant |
No Relevant |
No Relevant |
Floods |
No Change |
Increase |
No Change |
Increase |
Landslide |
No Change |
Increase |
No Change |
Increase |
Aridity |
No Change |
Increase |
Large Increase |
Large Increase |
Drought |
No Change |
Increase |
Large Increase |
Large Increase |
Wildfire |
No Change |
Increase |
Increase |
Increase |
Coastal flood |
Increase |
Increase |
Increase |
Increase |
Wind |
No Change |
No Change |
No Change |
No Change |