Amphos 21 Santiago Chile
Background
Santiago de Chile is located at an elevation of 570 m above sea level.
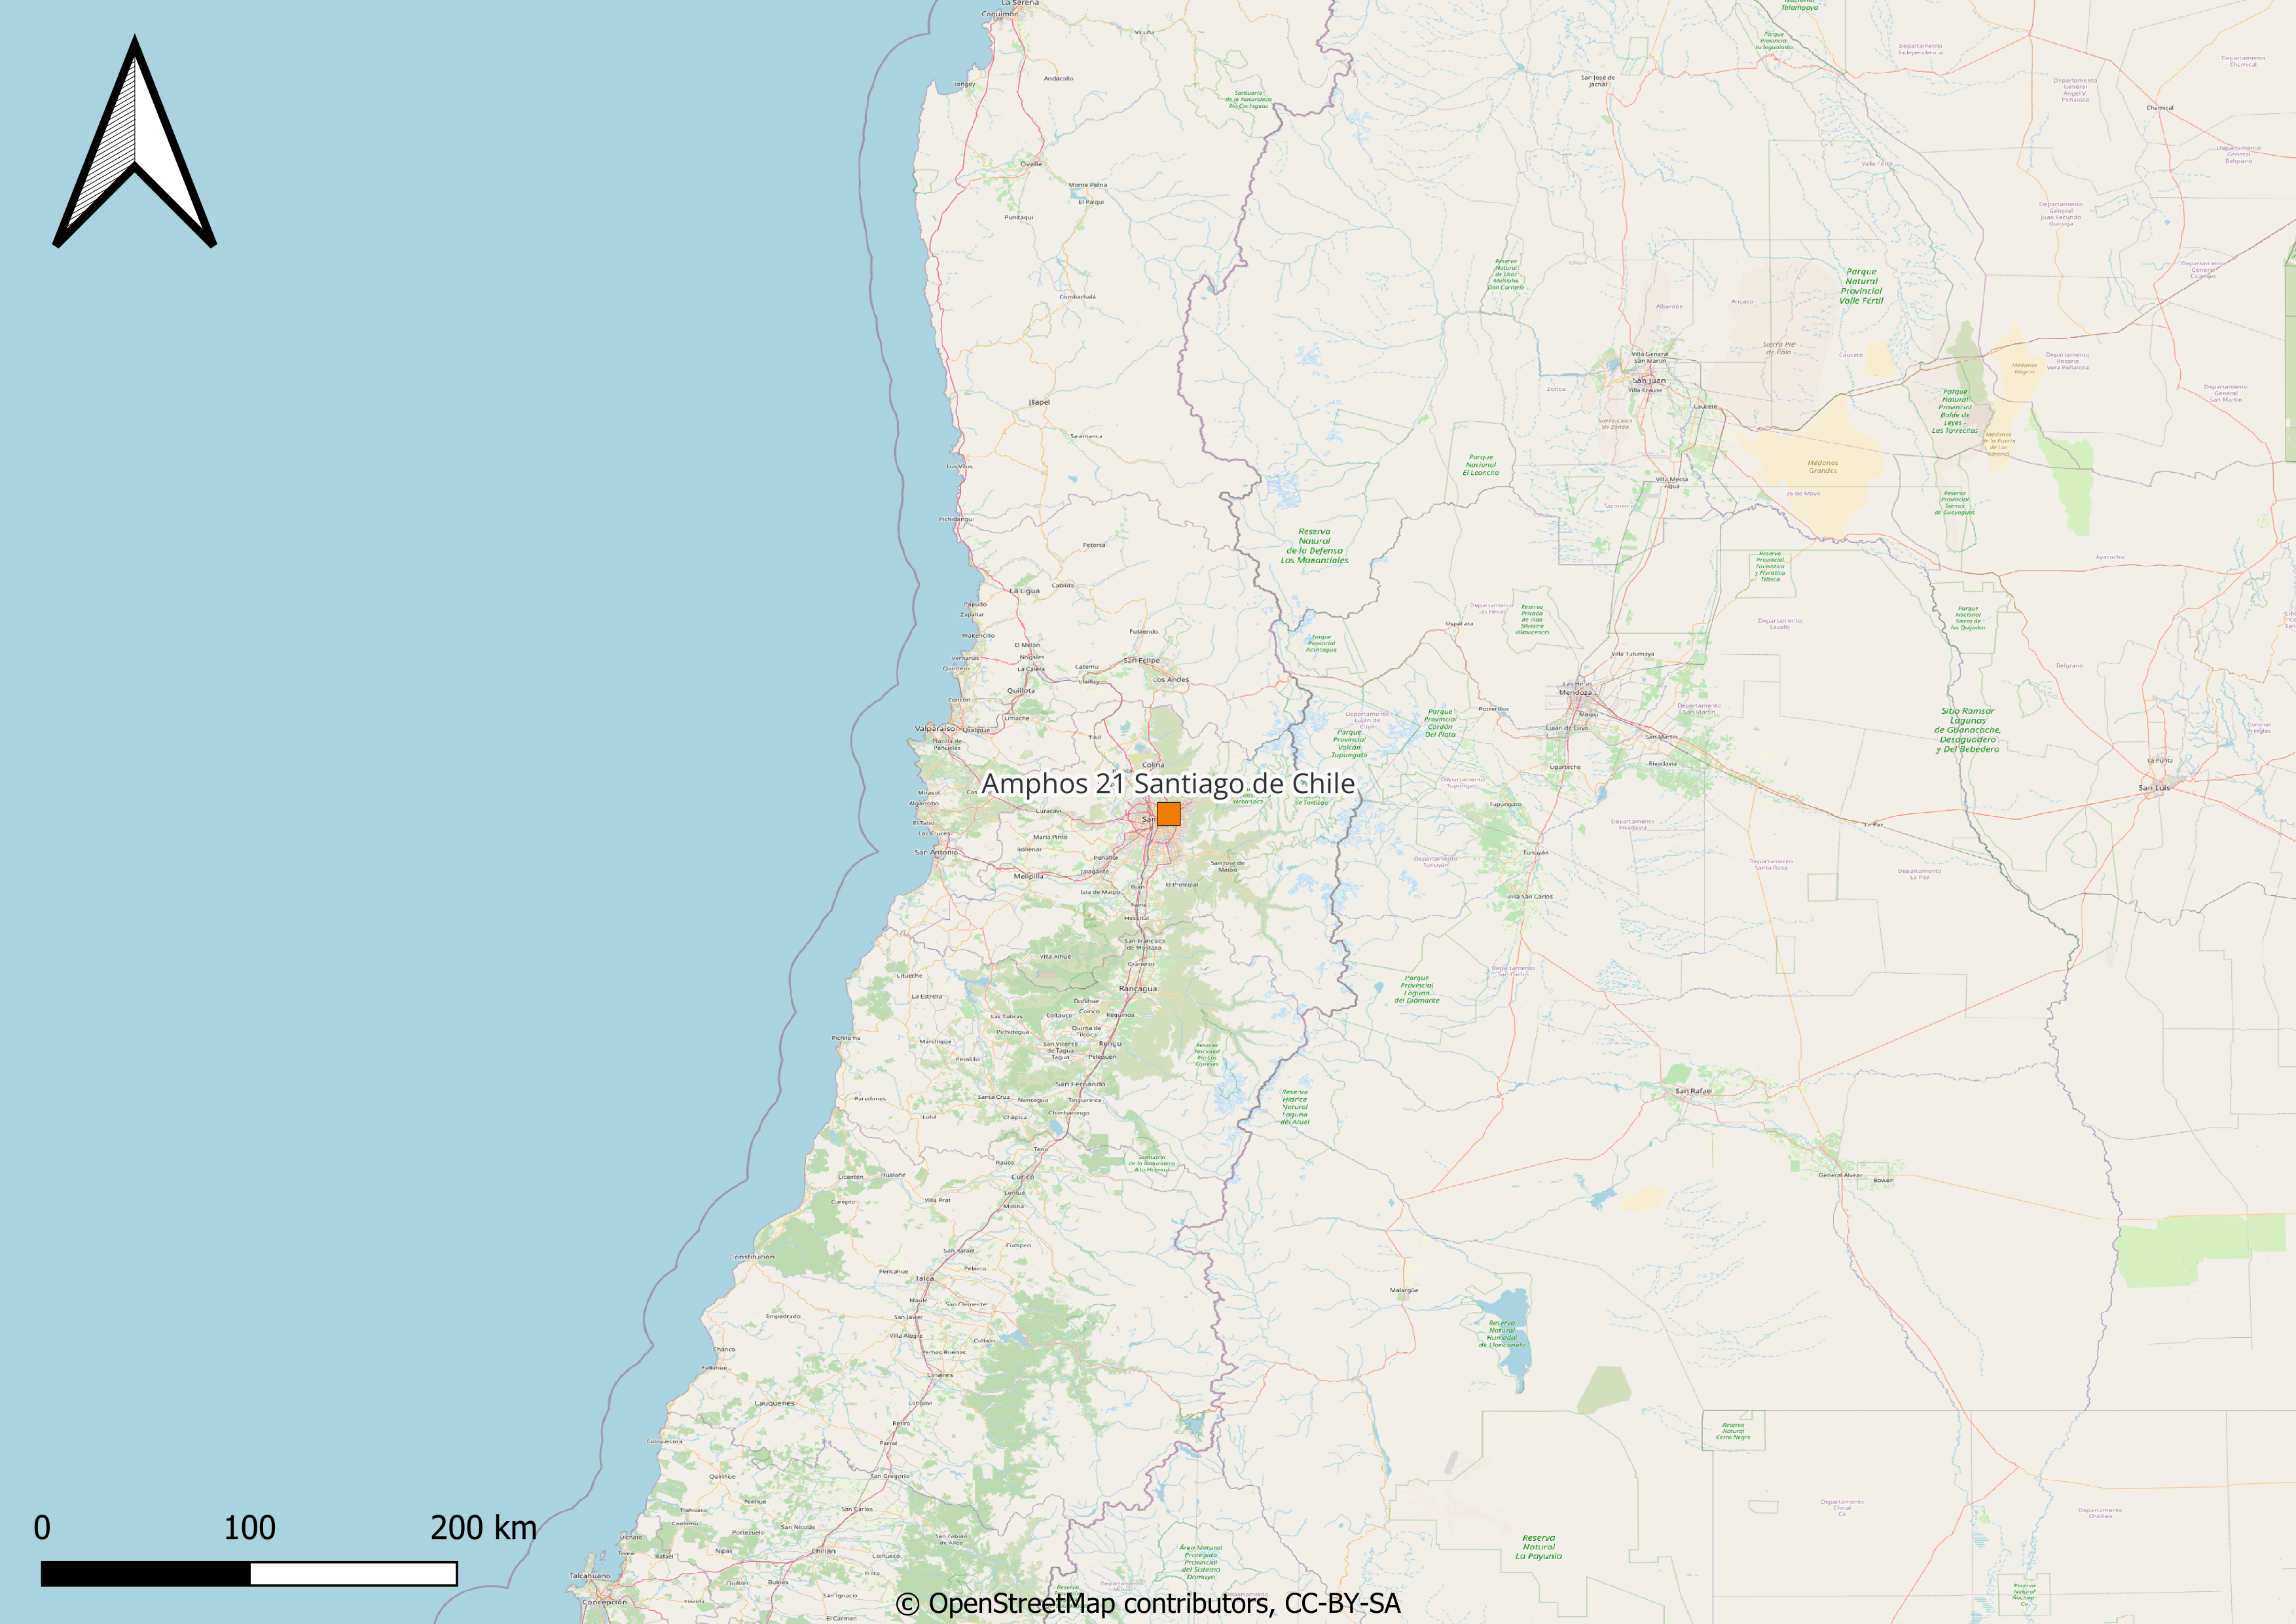
Fig. 13 Location of the Amphos21 office in Santiago de Chile.
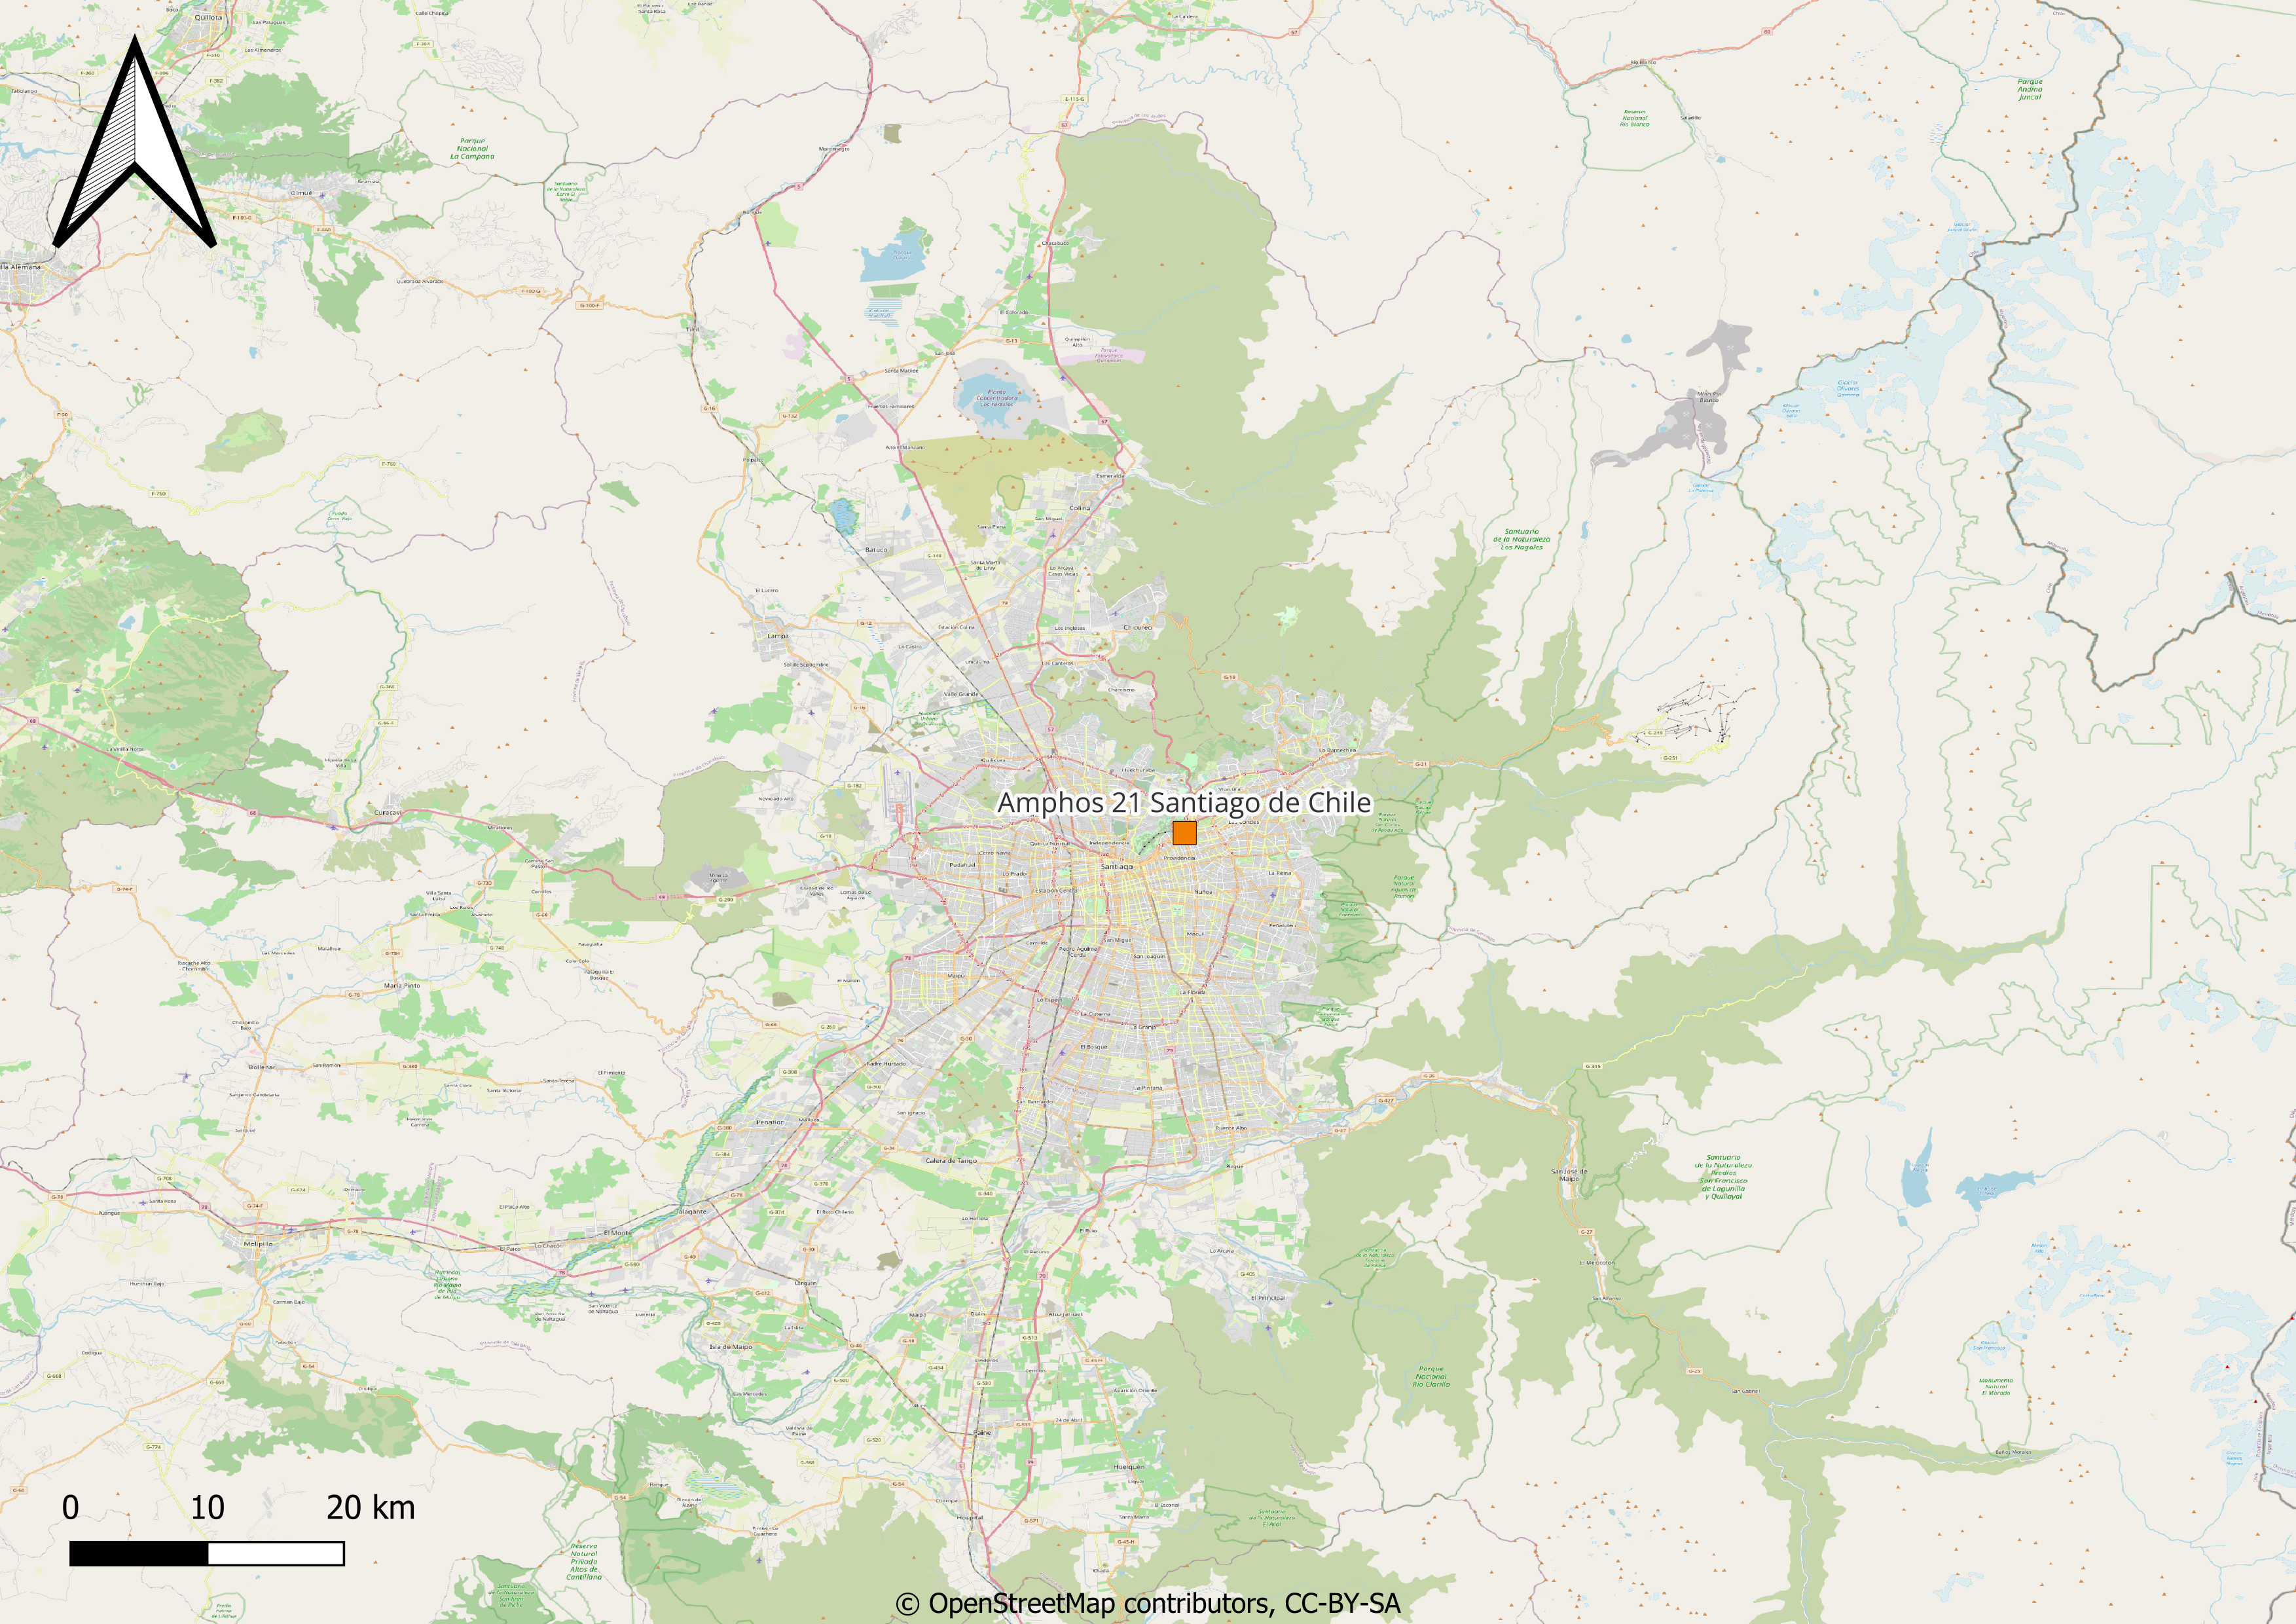
Fig. 14 Detailed location of the Amphos21 office in Santiago de Chile.
Natural risk past events
No climate-related past events or special adaptation measures have been reported from the Santiago de Chile office.
Current Baseline
The climate of Santiago de Chile can be considered almost Mediterranean, since winters (June to August) are mild and relatively rainy, and summers (December to February) are warm and sunny. However, the rainy period is short, so the climate is arid. Also, summer nights are cool, and sometimes even cold, due to the altitude.
The eastern districts of the city, in addition to being a little colder due to the altitude, are a little more rainy, in fact rainfall exceeds 350 mm per year.
In winter, the temperature range is often considerable, and at night the temperature can drop below freezing. In addition, fog can form in periods of stable weather. Snow in Santiago is very rare, however, occasionally, a snowfall can occur, especially in the eastern districts of the city. In summer, nights are cool, but it can be very hot during the day.
Variable |
Jan |
Feb |
Mar |
Apr |
May |
Jun |
Jul |
Aug |
Sep |
Oct |
Nov |
Dec |
Year |
|---|---|---|---|---|---|---|---|---|---|---|---|---|---|
Minimum temperature (°C) |
13.8 |
12.9 |
10.9 |
8.1 |
5.7 |
3.8 |
2.9 |
4.0 |
5.7 |
8.2 |
10.3 |
12.5 |
8.4 |
Maximum temperature (°C) |
29.6 |
28.5 |
26.2 |
22.4 |
17.9 |
14.2 |
14.3 |
16.0 |
18.6 |
21.8 |
25.7 |
28.5 |
20.2 |
Average temperature (°C) |
21.7 |
20.7 |
18.5 |
15.3 |
11.8 |
9.0 |
8.6 |
10.0 |
12.1 |
15.0 |
18.0 |
20.5 |
15.4 |
Precipitation (mm) |
2.0 |
4.0 |
6.0 |
19.0 |
71.0 |
92.0 |
84.0 |
69.0 |
32.0 |
19.0 |
8.0 |
4.0 |
410.0 |
Santiago presents a high (40%-80%) water stress and a medium-high drought risk. The probability of fire risk is low with an Active Fires Frequency of 0.0097 fires per year between 2003-2021. The facility is located in an area close to water streams, it is exposed to river floodings. No landslide risk is expected in the Santiago de Chile area.
The facility is located on an active tectonic plate and it is exposed to a very strong earthquake risk.
Santiago is not located close to the sea at an elevation of 570 m and it is not exposed to coastal flooding and tropical cyclones risk.
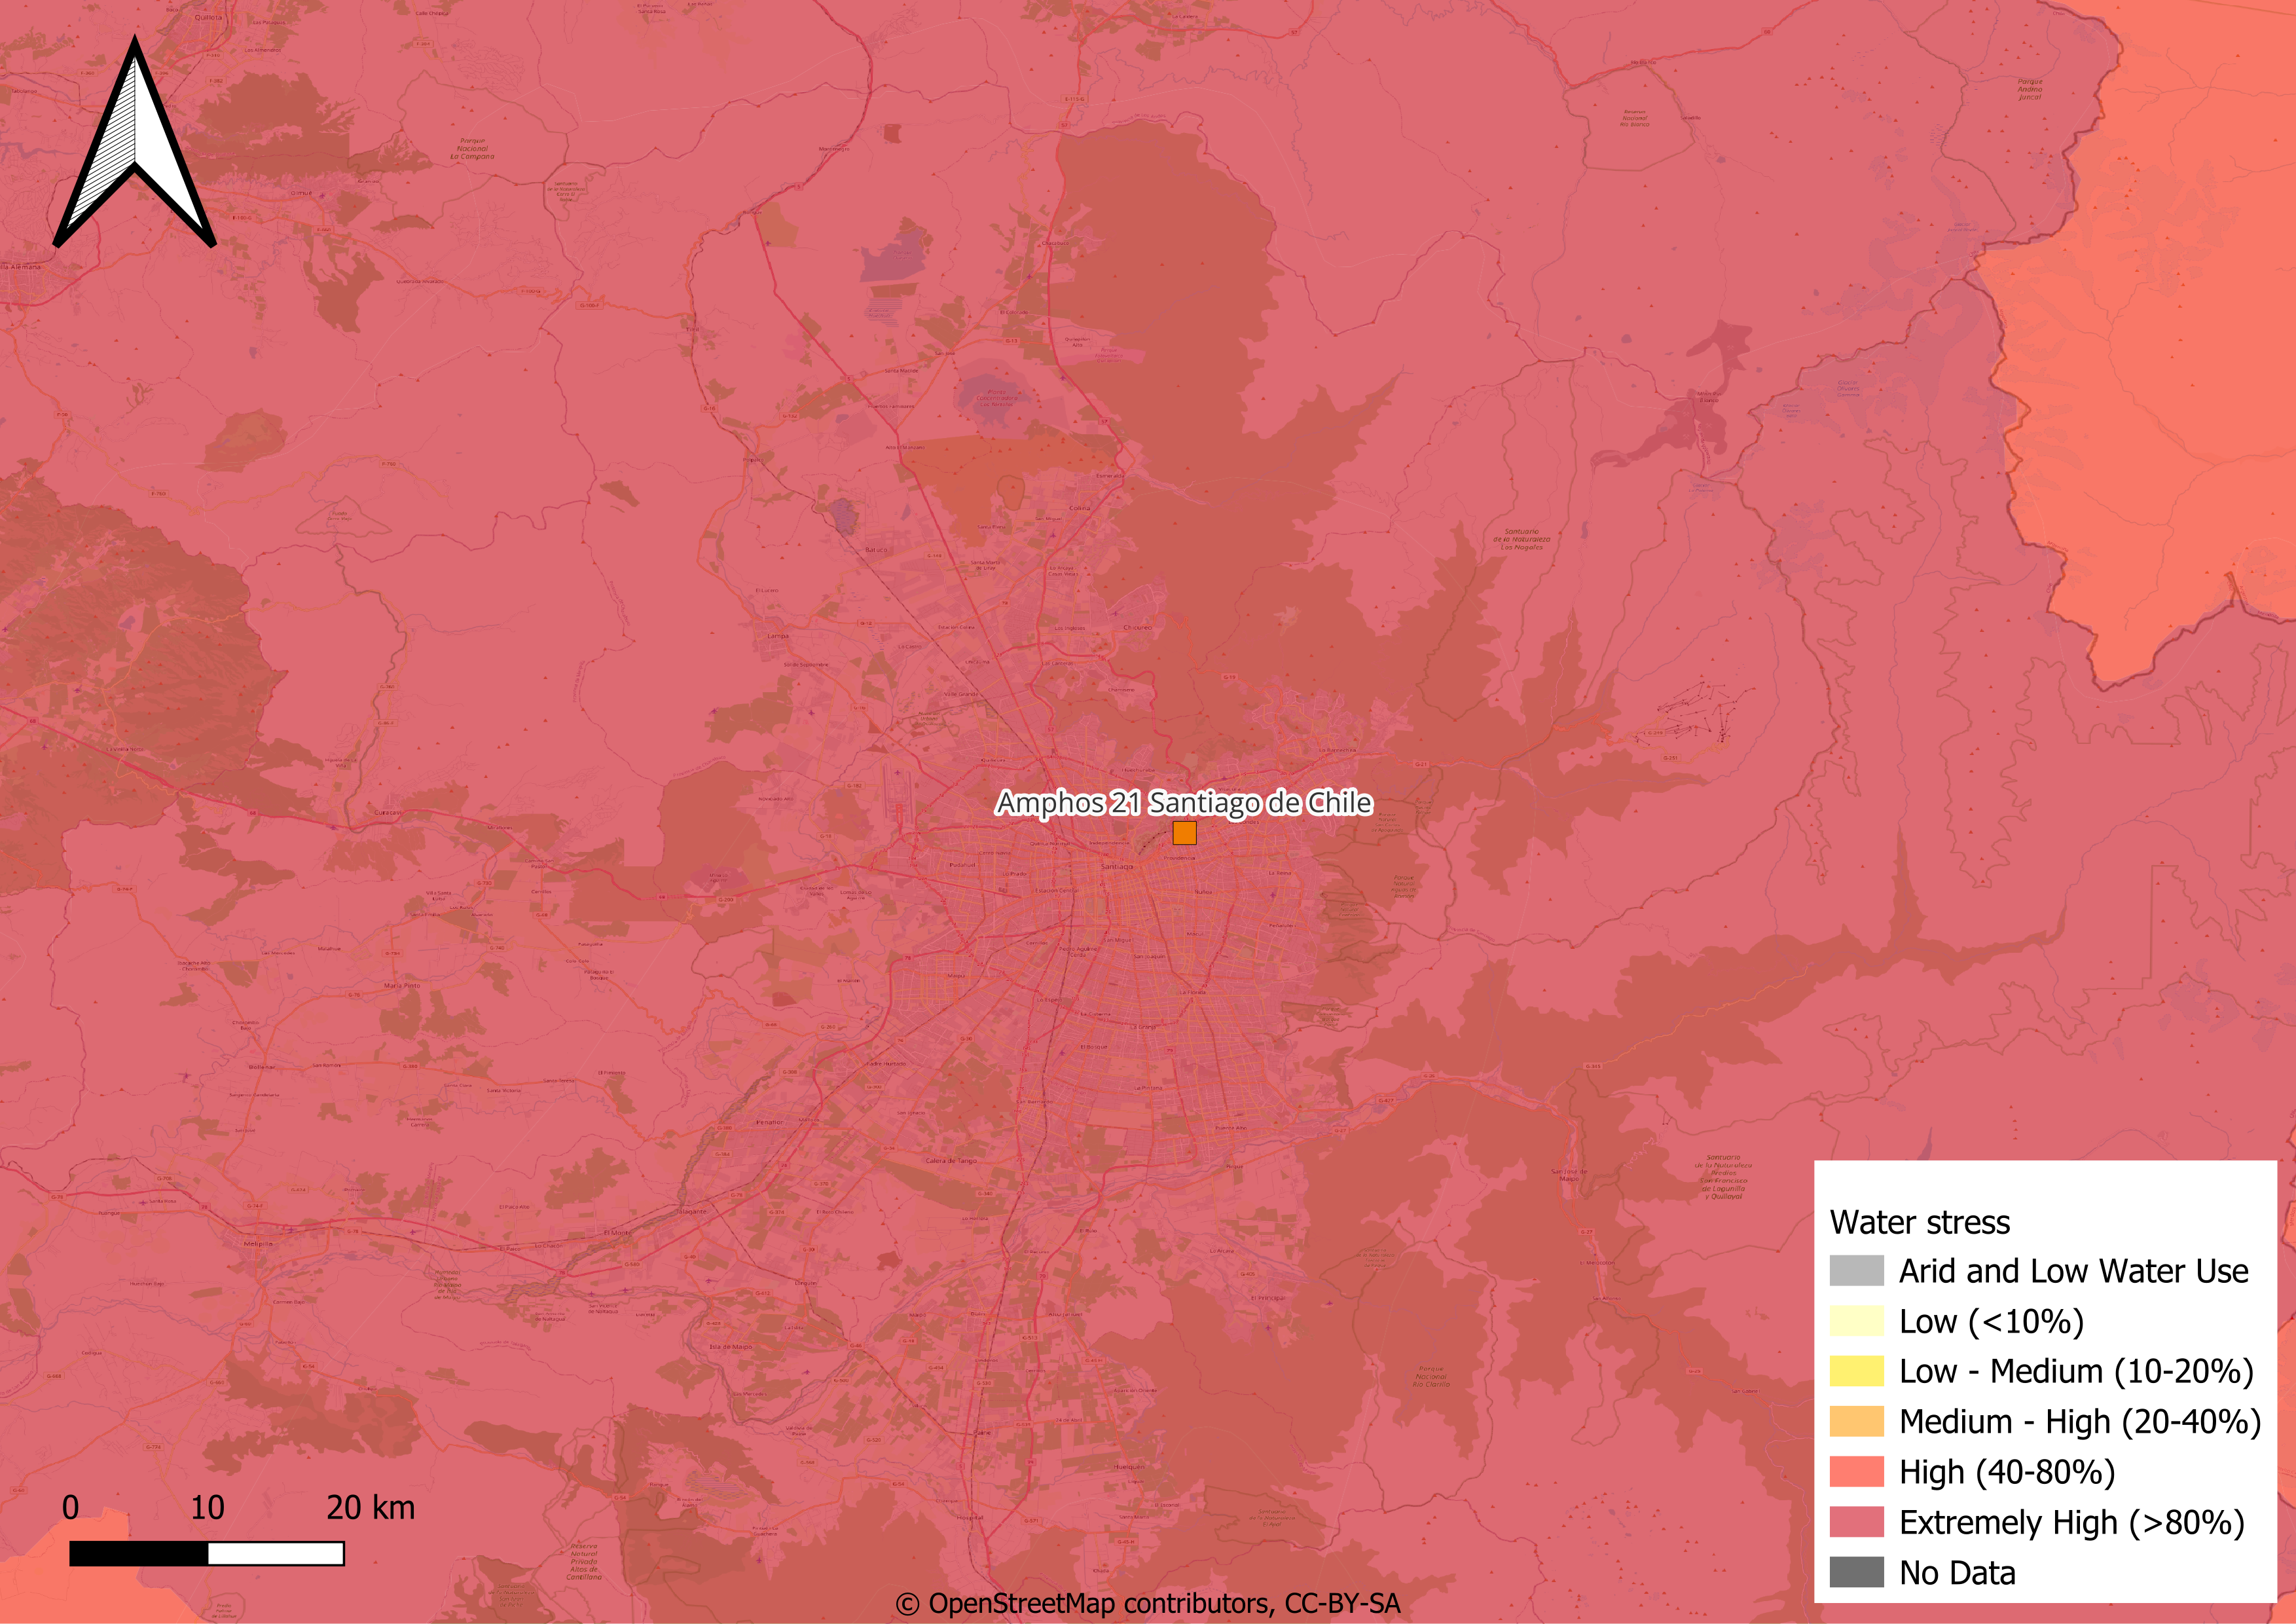
Fig. 15 Present-day water stress in Santiago. Source: Aqueduct.
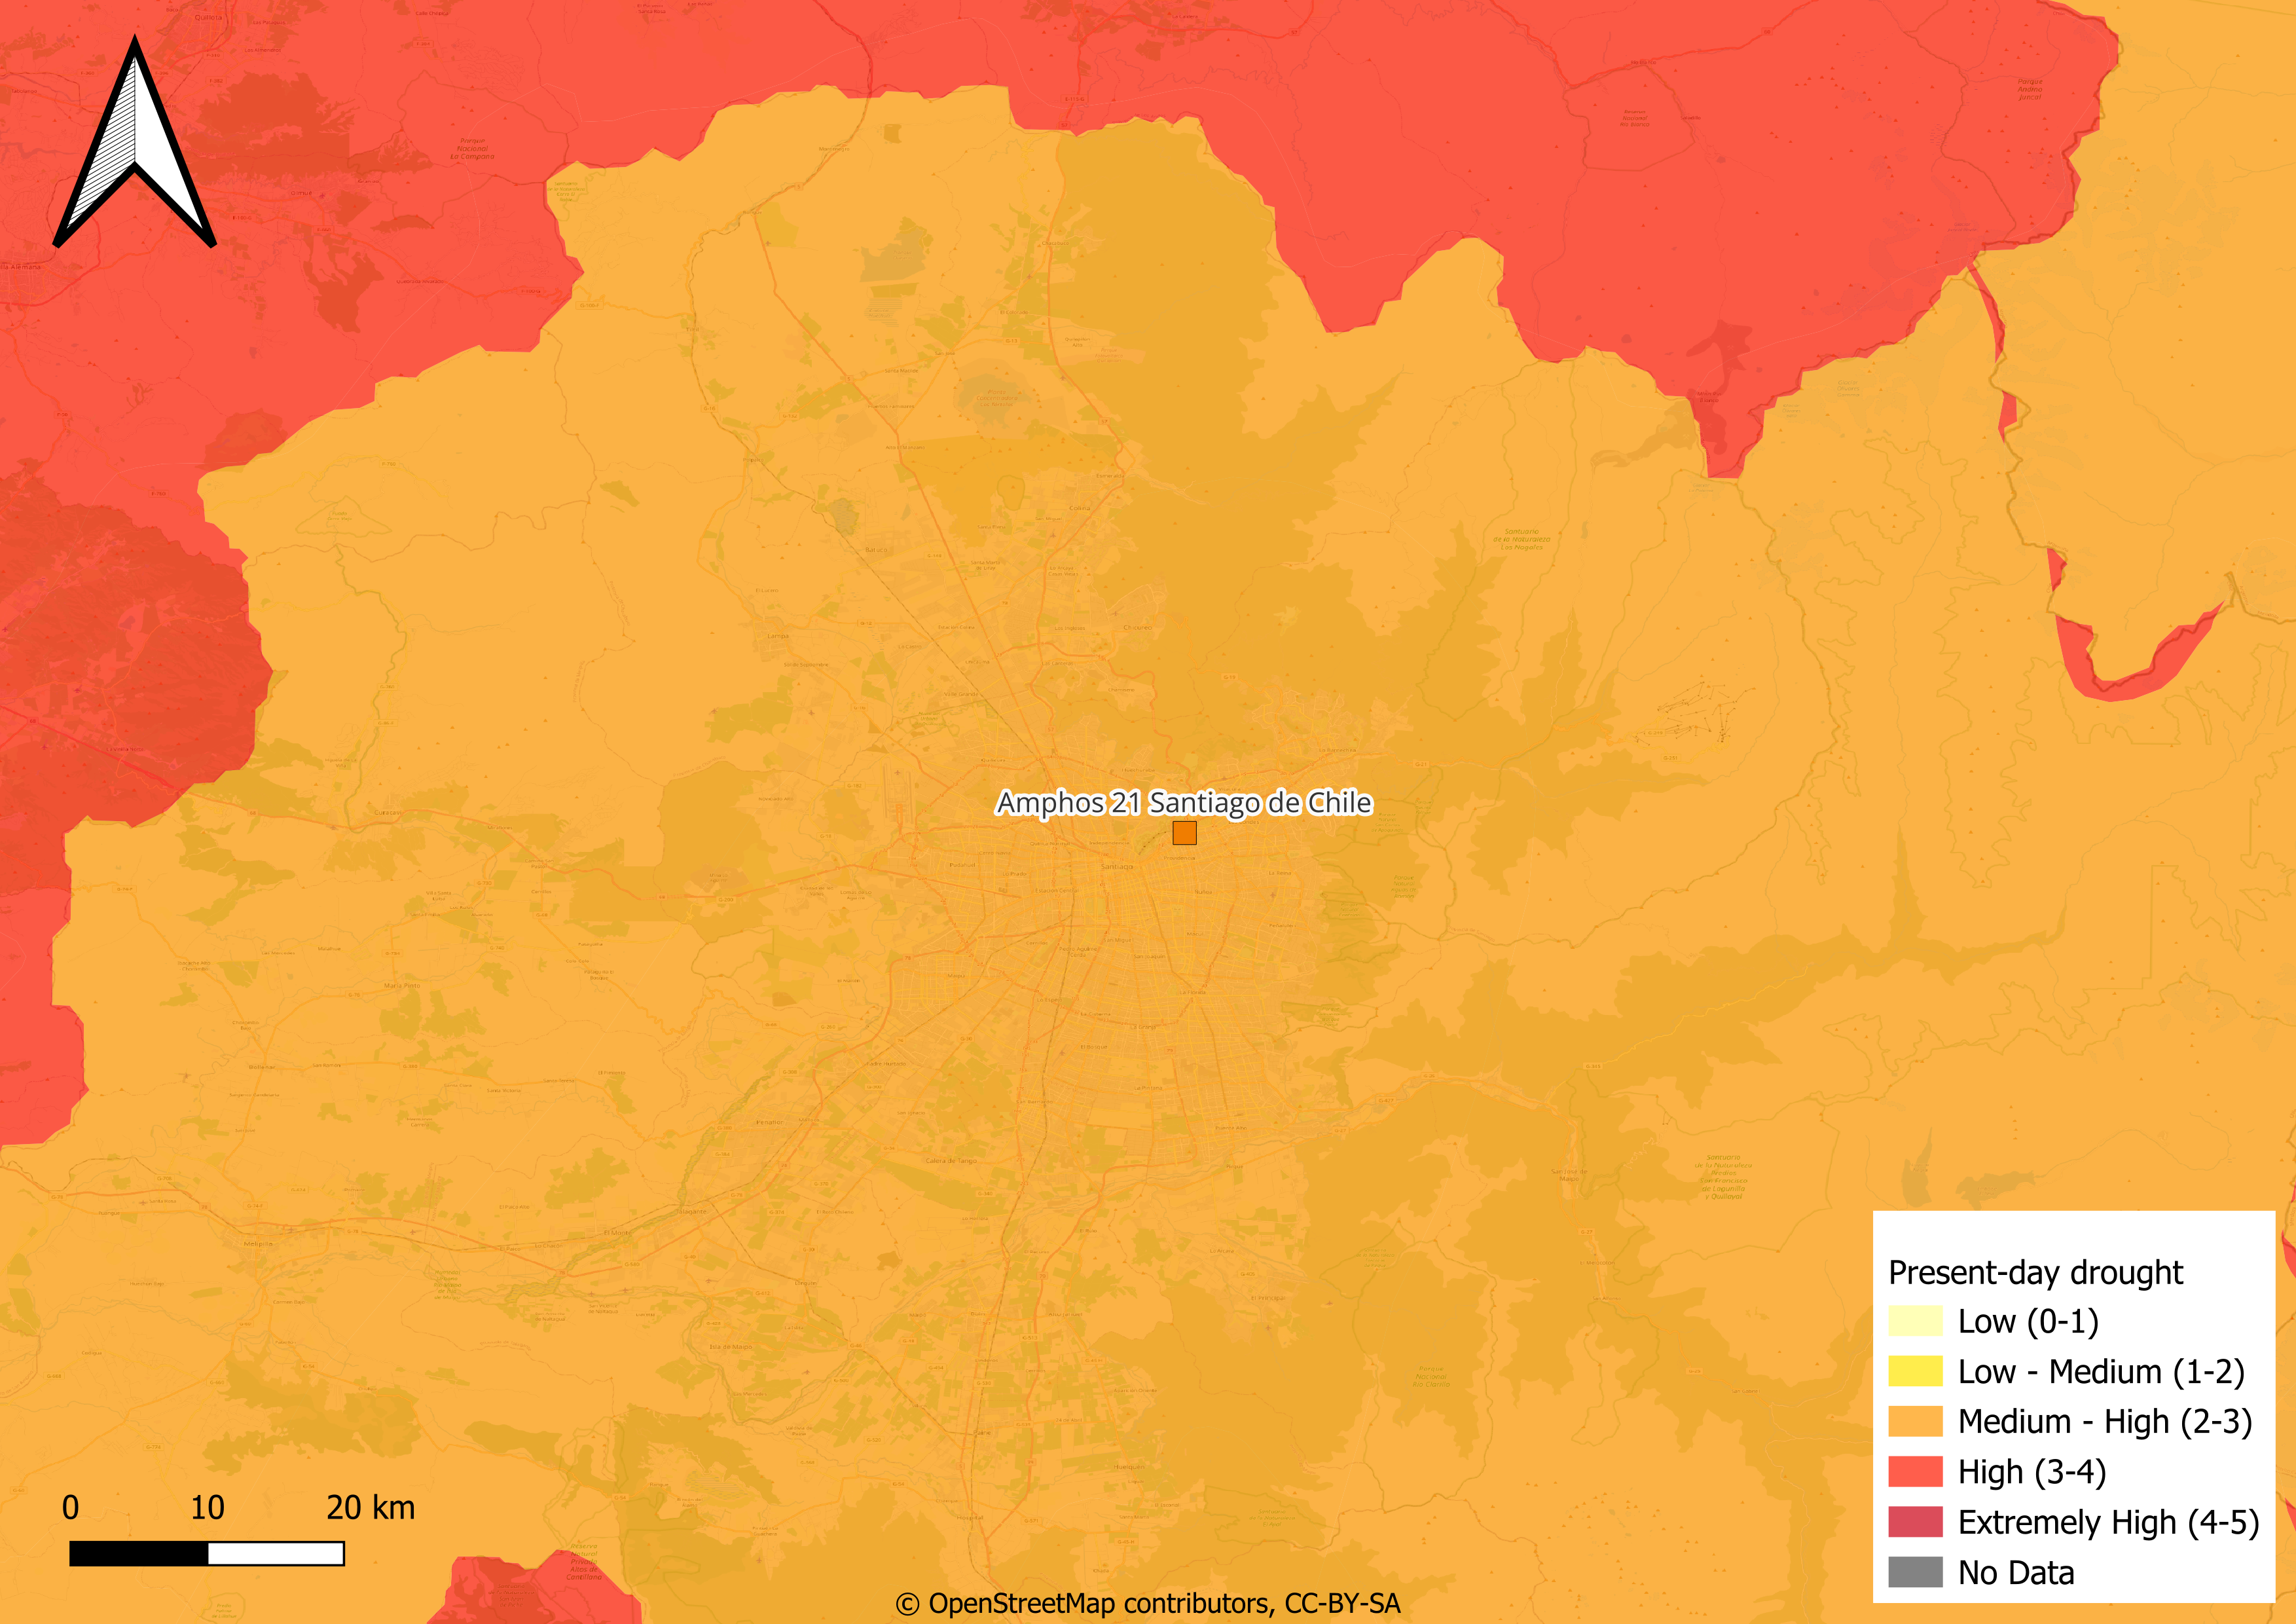
Fig. 16 Present-day drought in Santiago de Chile. Source: Aqueduct.
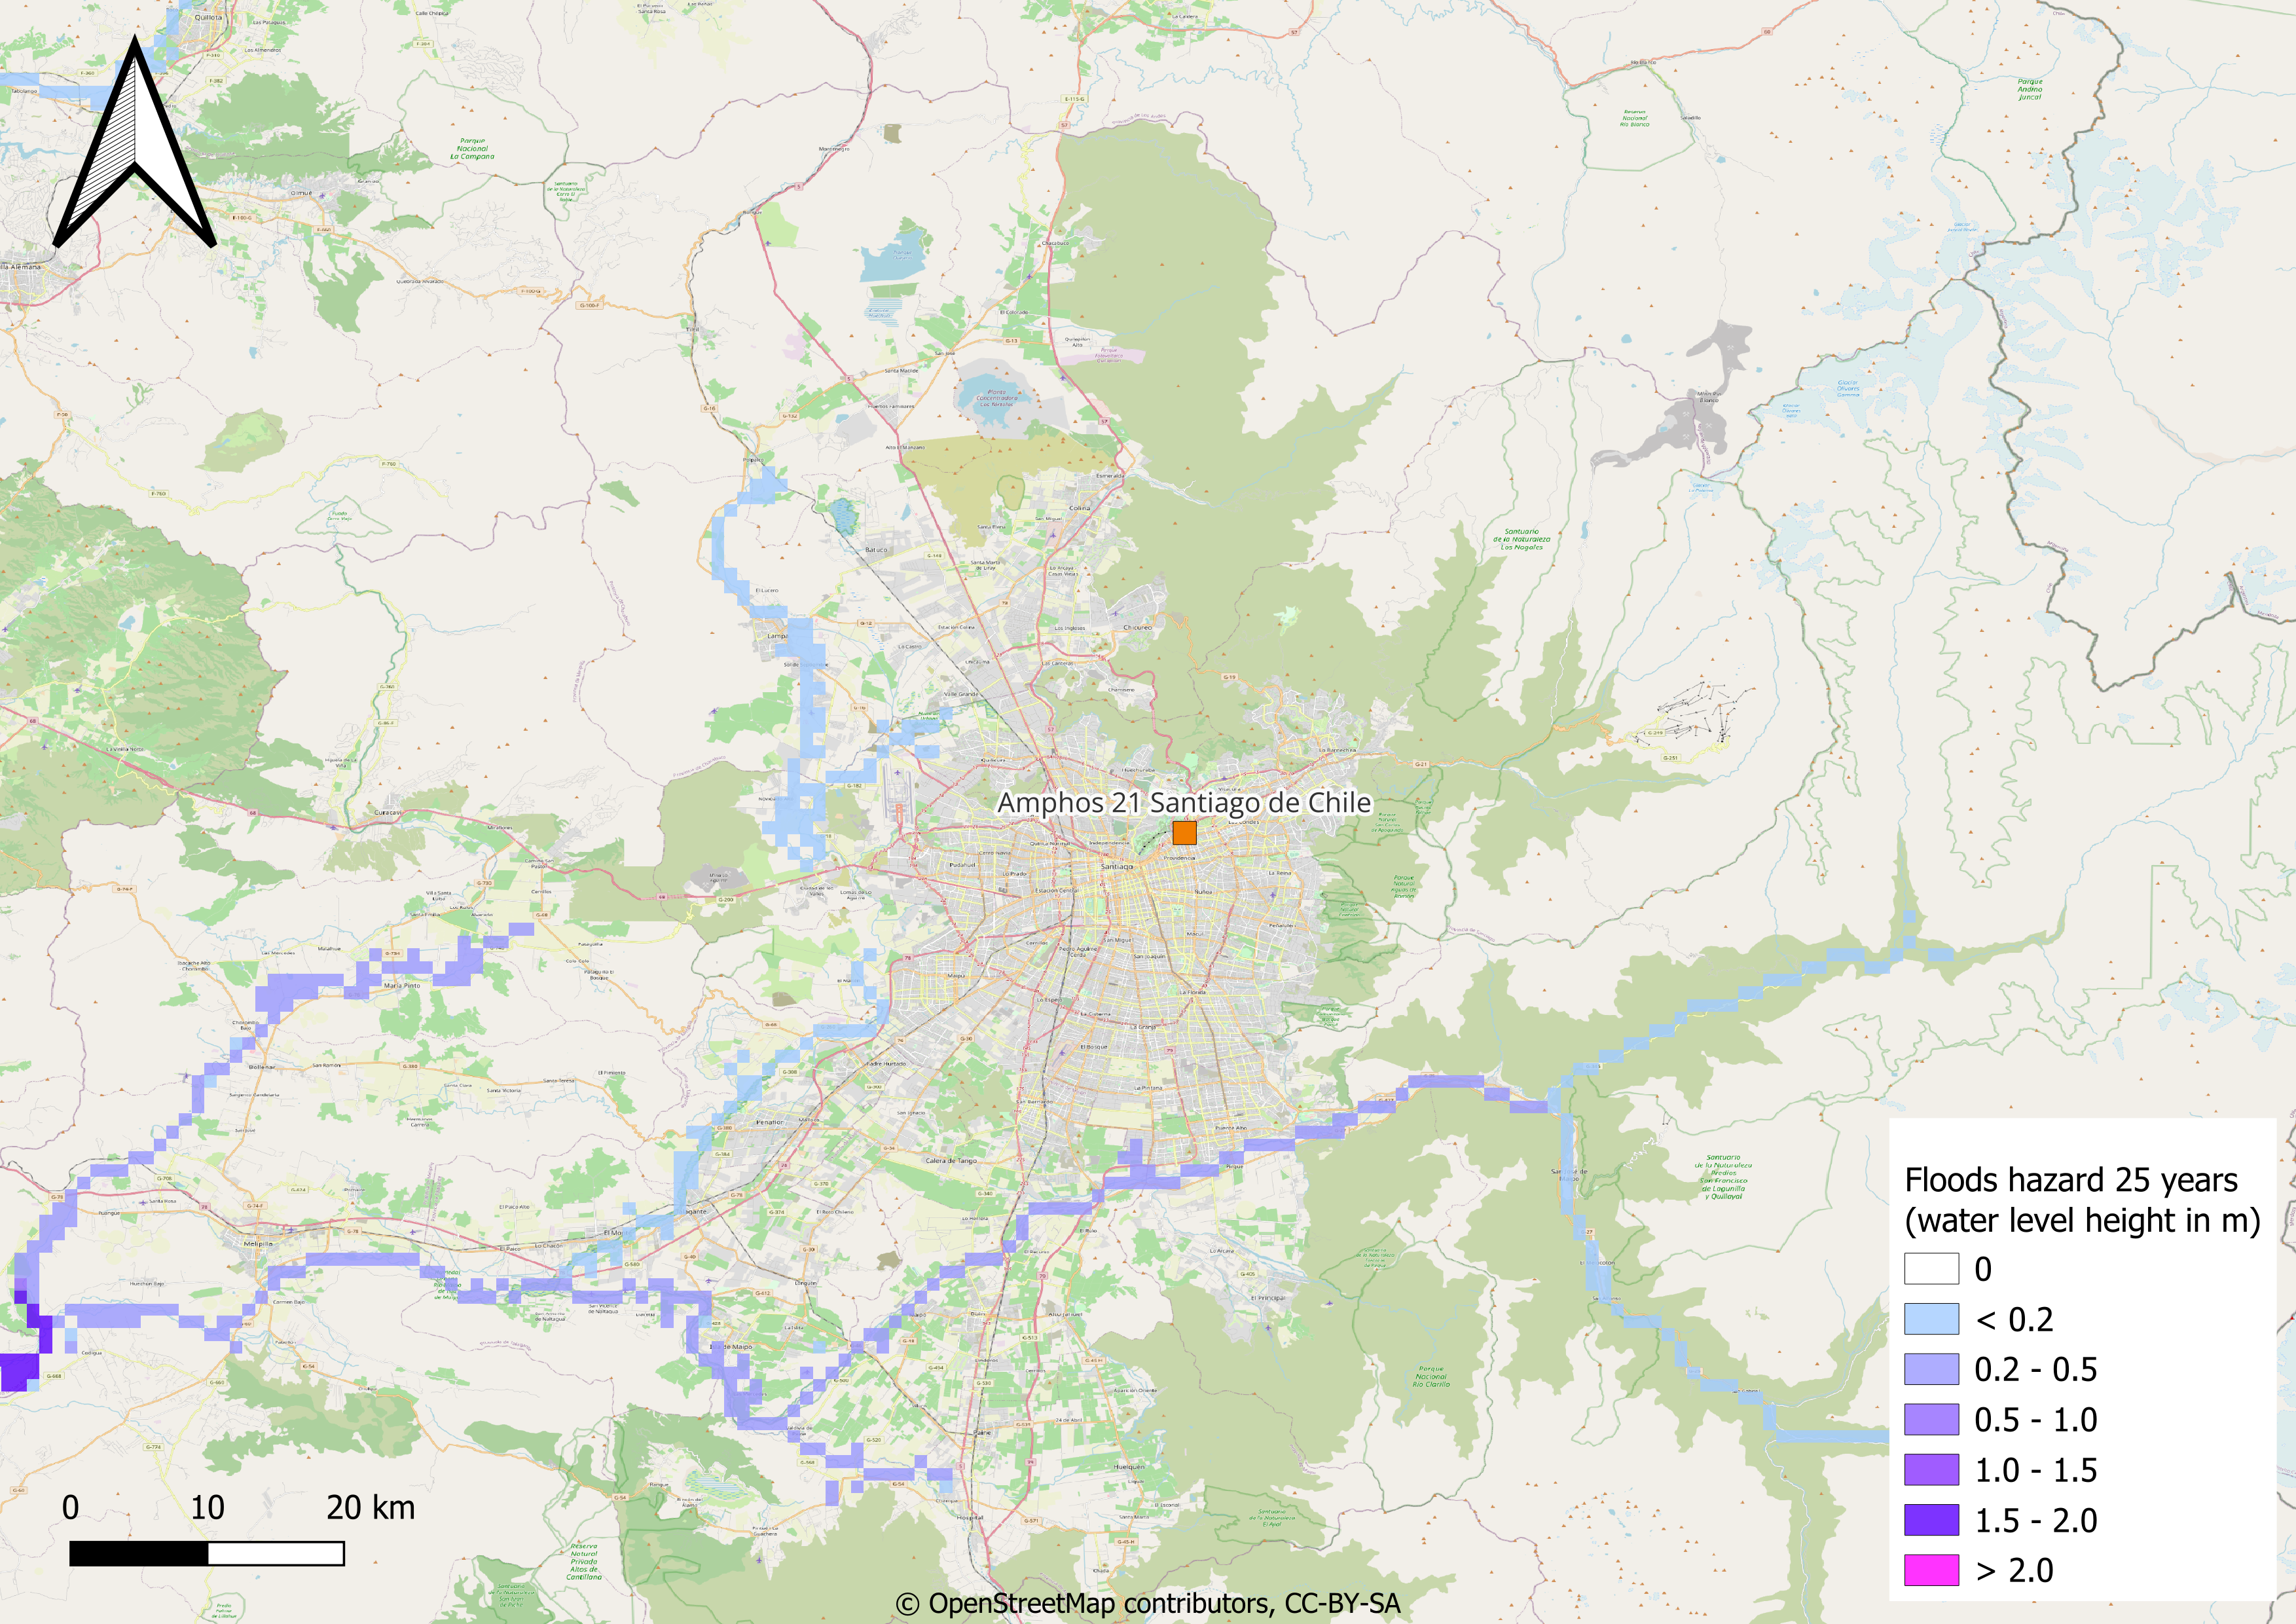
Fig. 17 Present-day flood hazard in a 25 years return period in Santiago. The values are expected water level high in meters. The return period indicates that the flood of this magnitude is expected once every 25 years. Source: GAR Atlas global flood.

Fig. 18 Present-day flood hazard in a 100 years return period in Santiago. The values are expected water level high in meters. The return period indicates that the flood of this magnitude is expected once every 100 years. Source: GAR Atlas global flood.
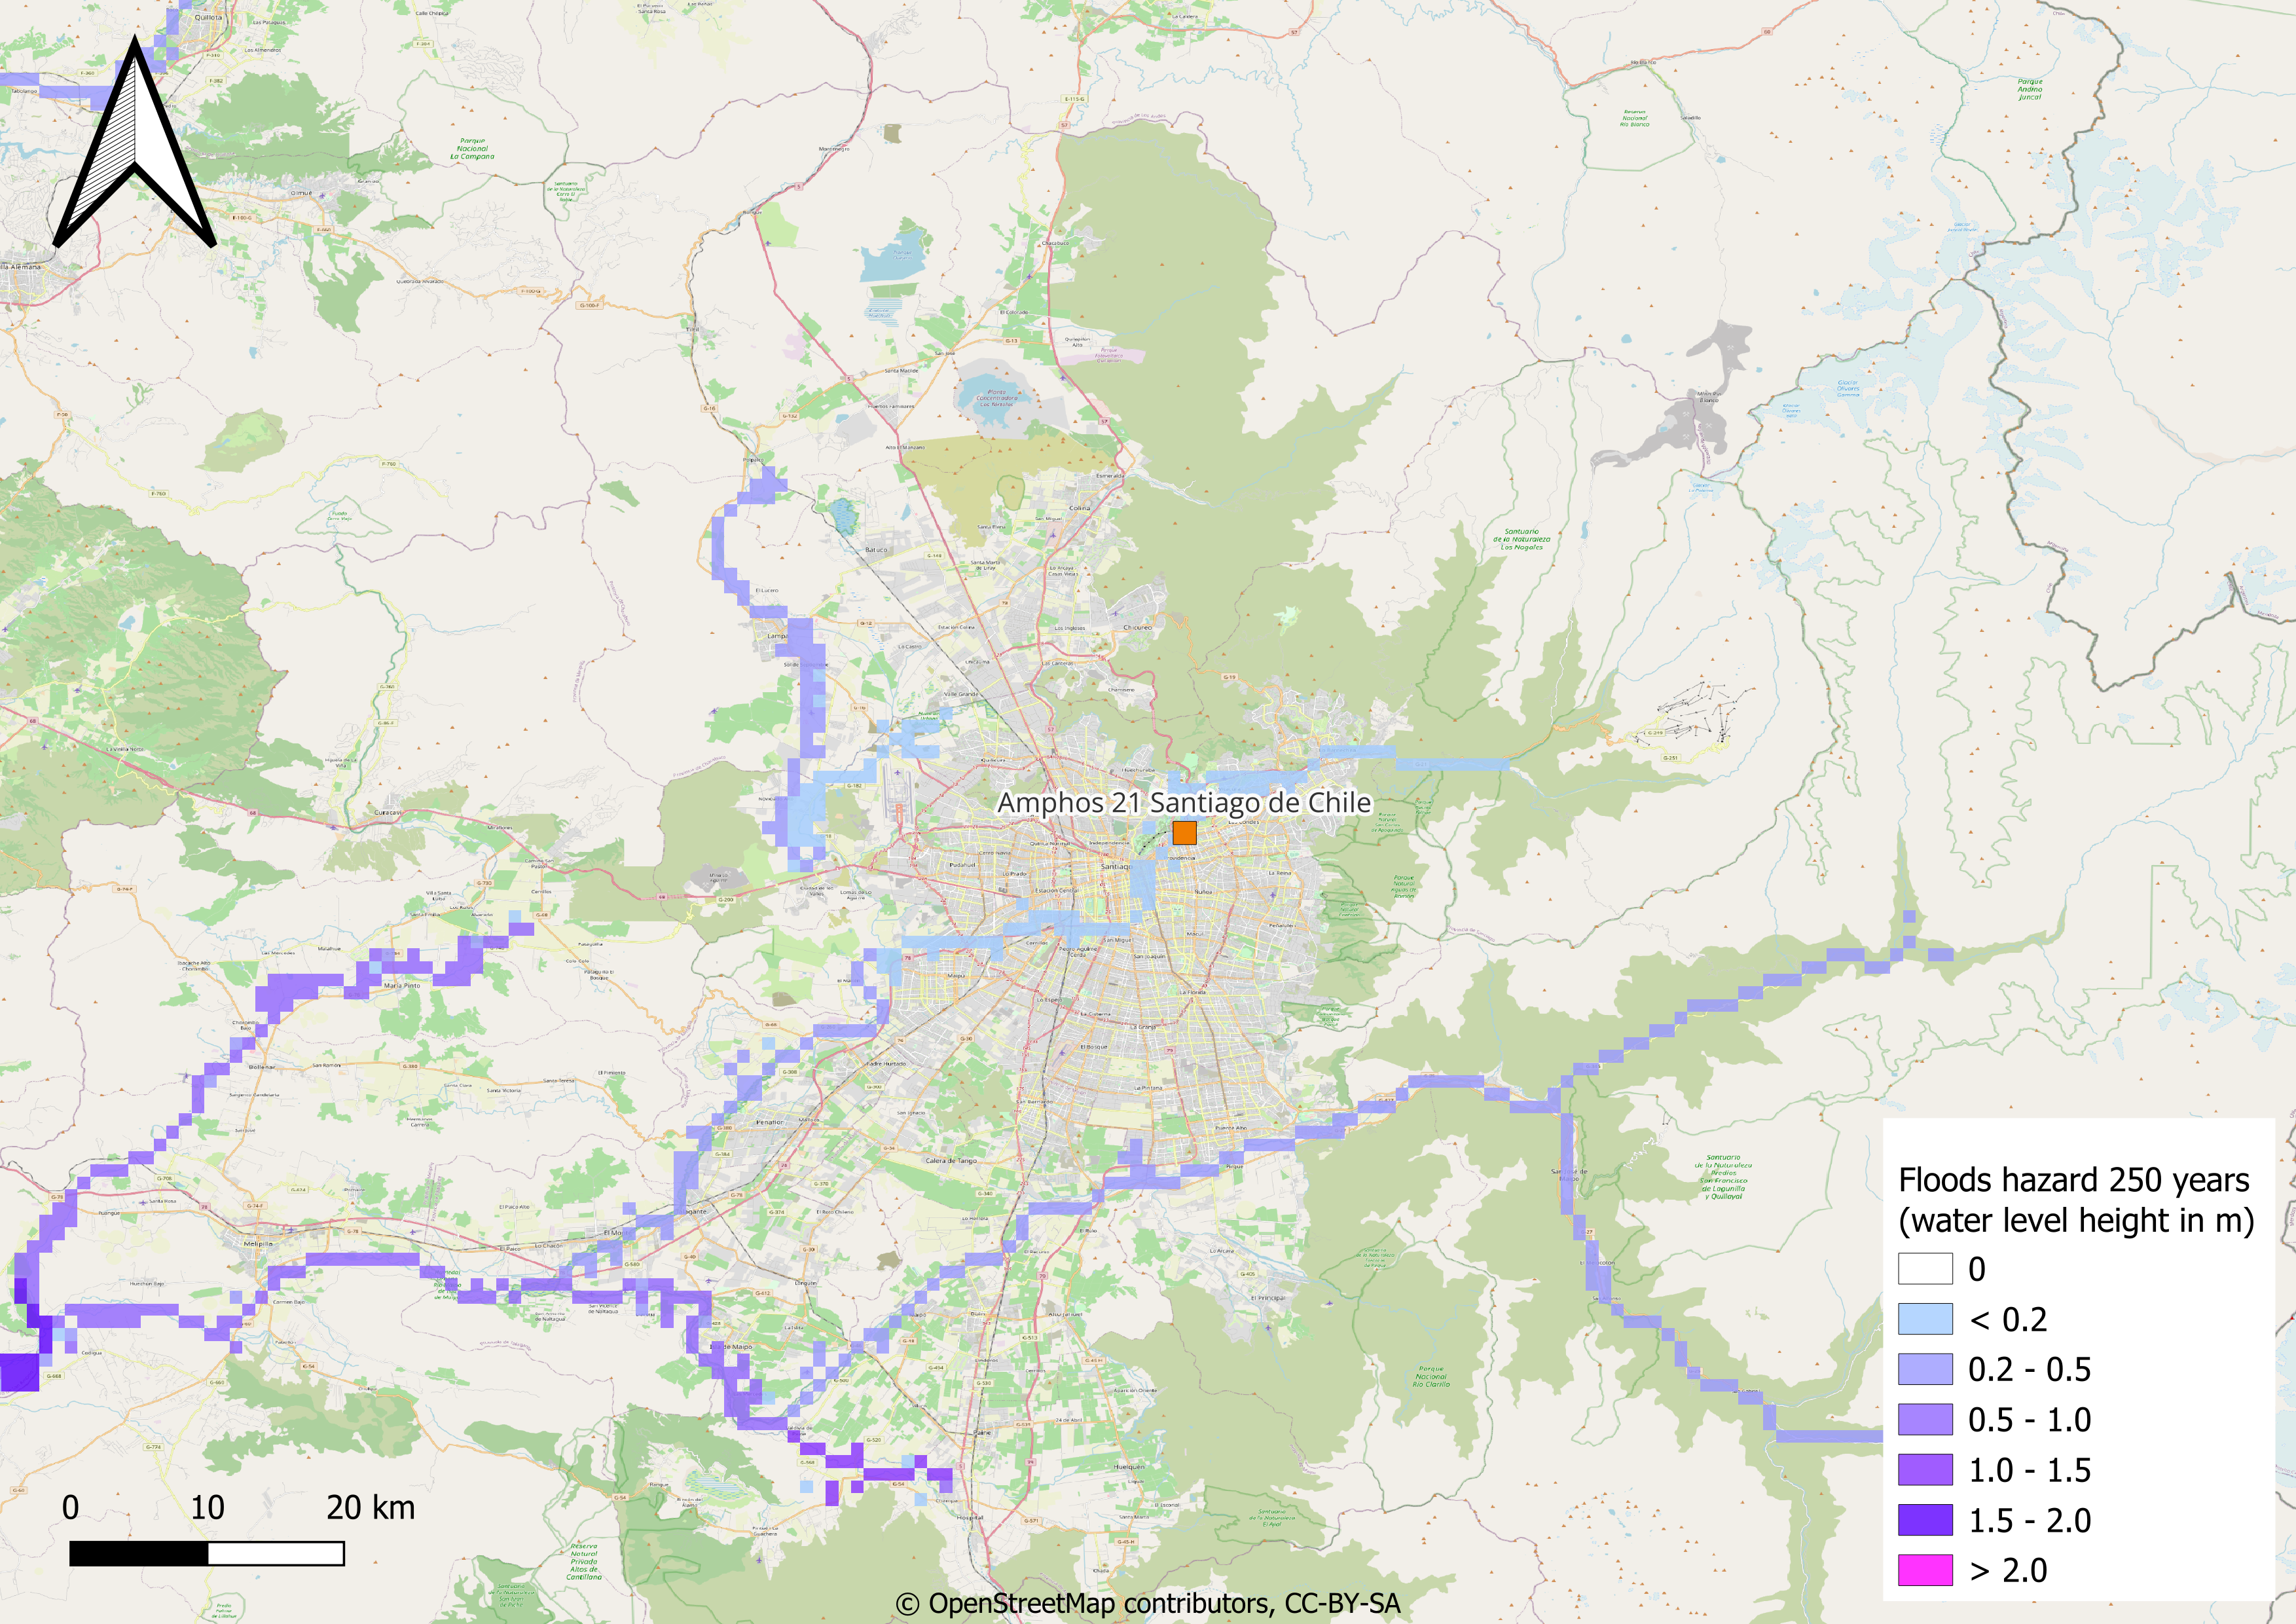
Fig. 19 Present-day flood hazard in a 250 years return period in Santiago. The values are expected water levels high in meters. The return period indicates that a flood of this magnitude is expected once every 250 years. Source: GAR Atlas global flood.
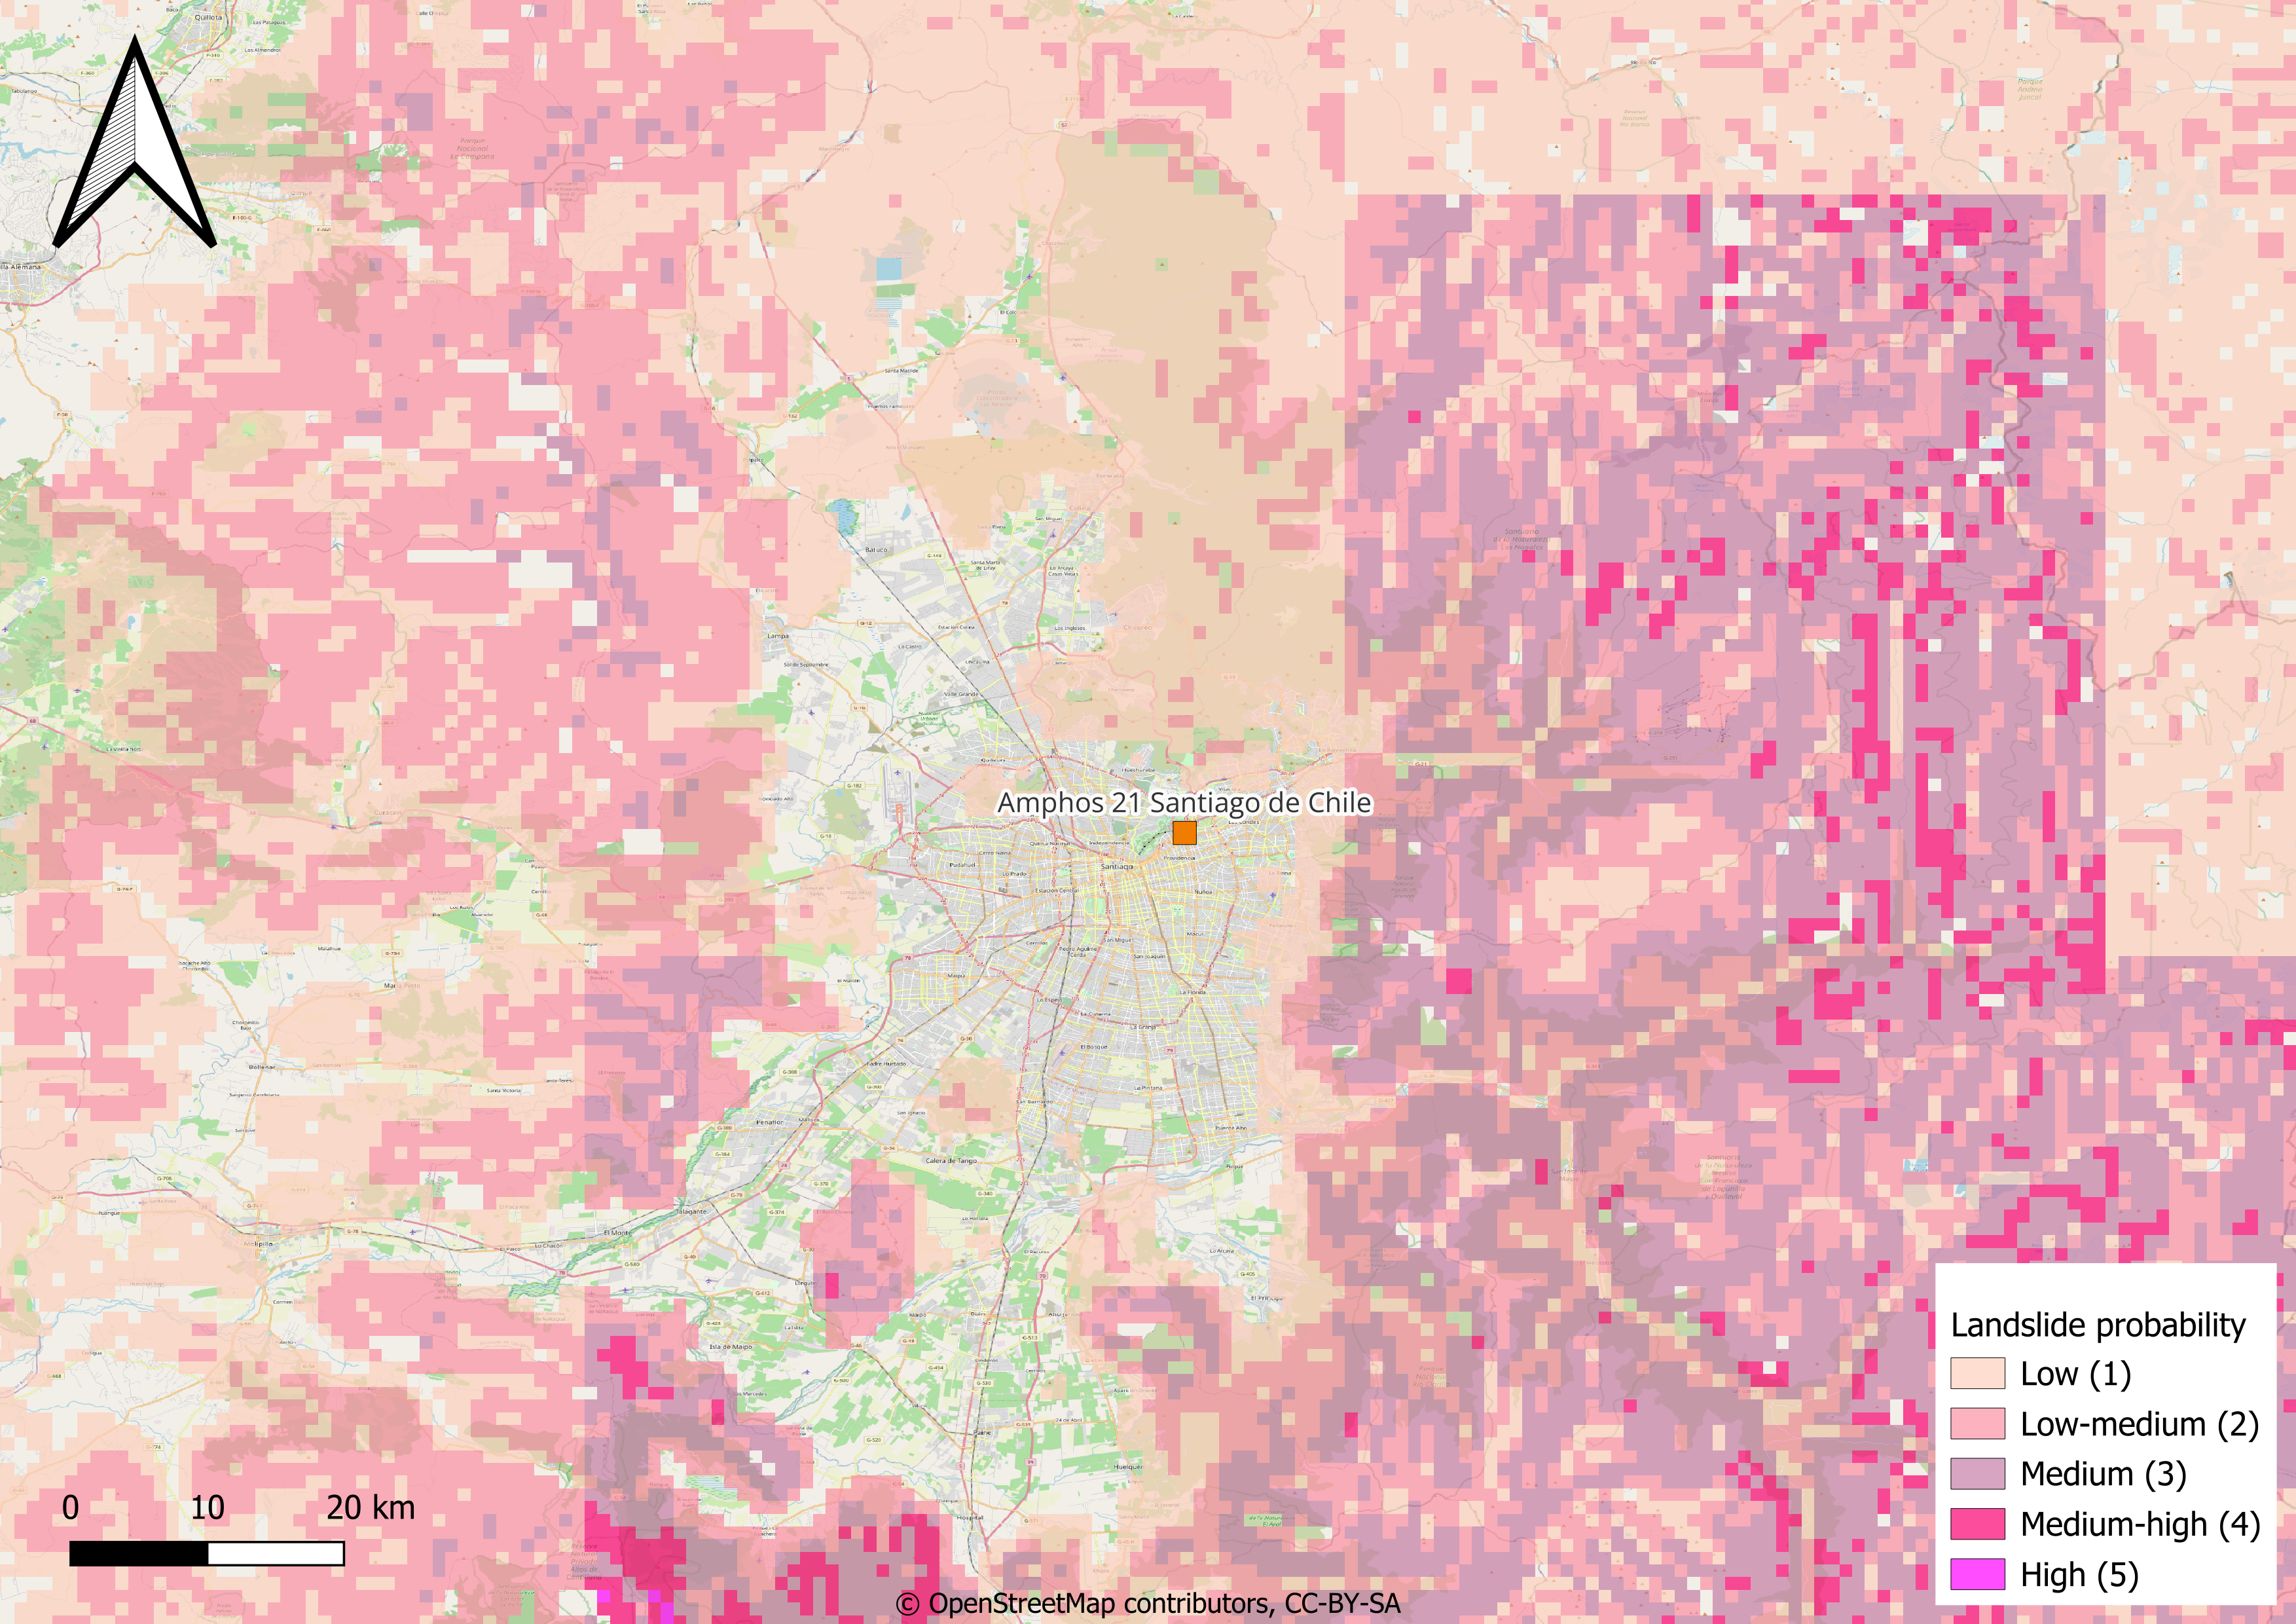
Fig. 20 Present-day frequency of landslides triggered by precipitation measured in expected annual probability and percentage of pixel of occurrence of a potentially destructive landslide event x 1000000. Source Global Assessment Report.
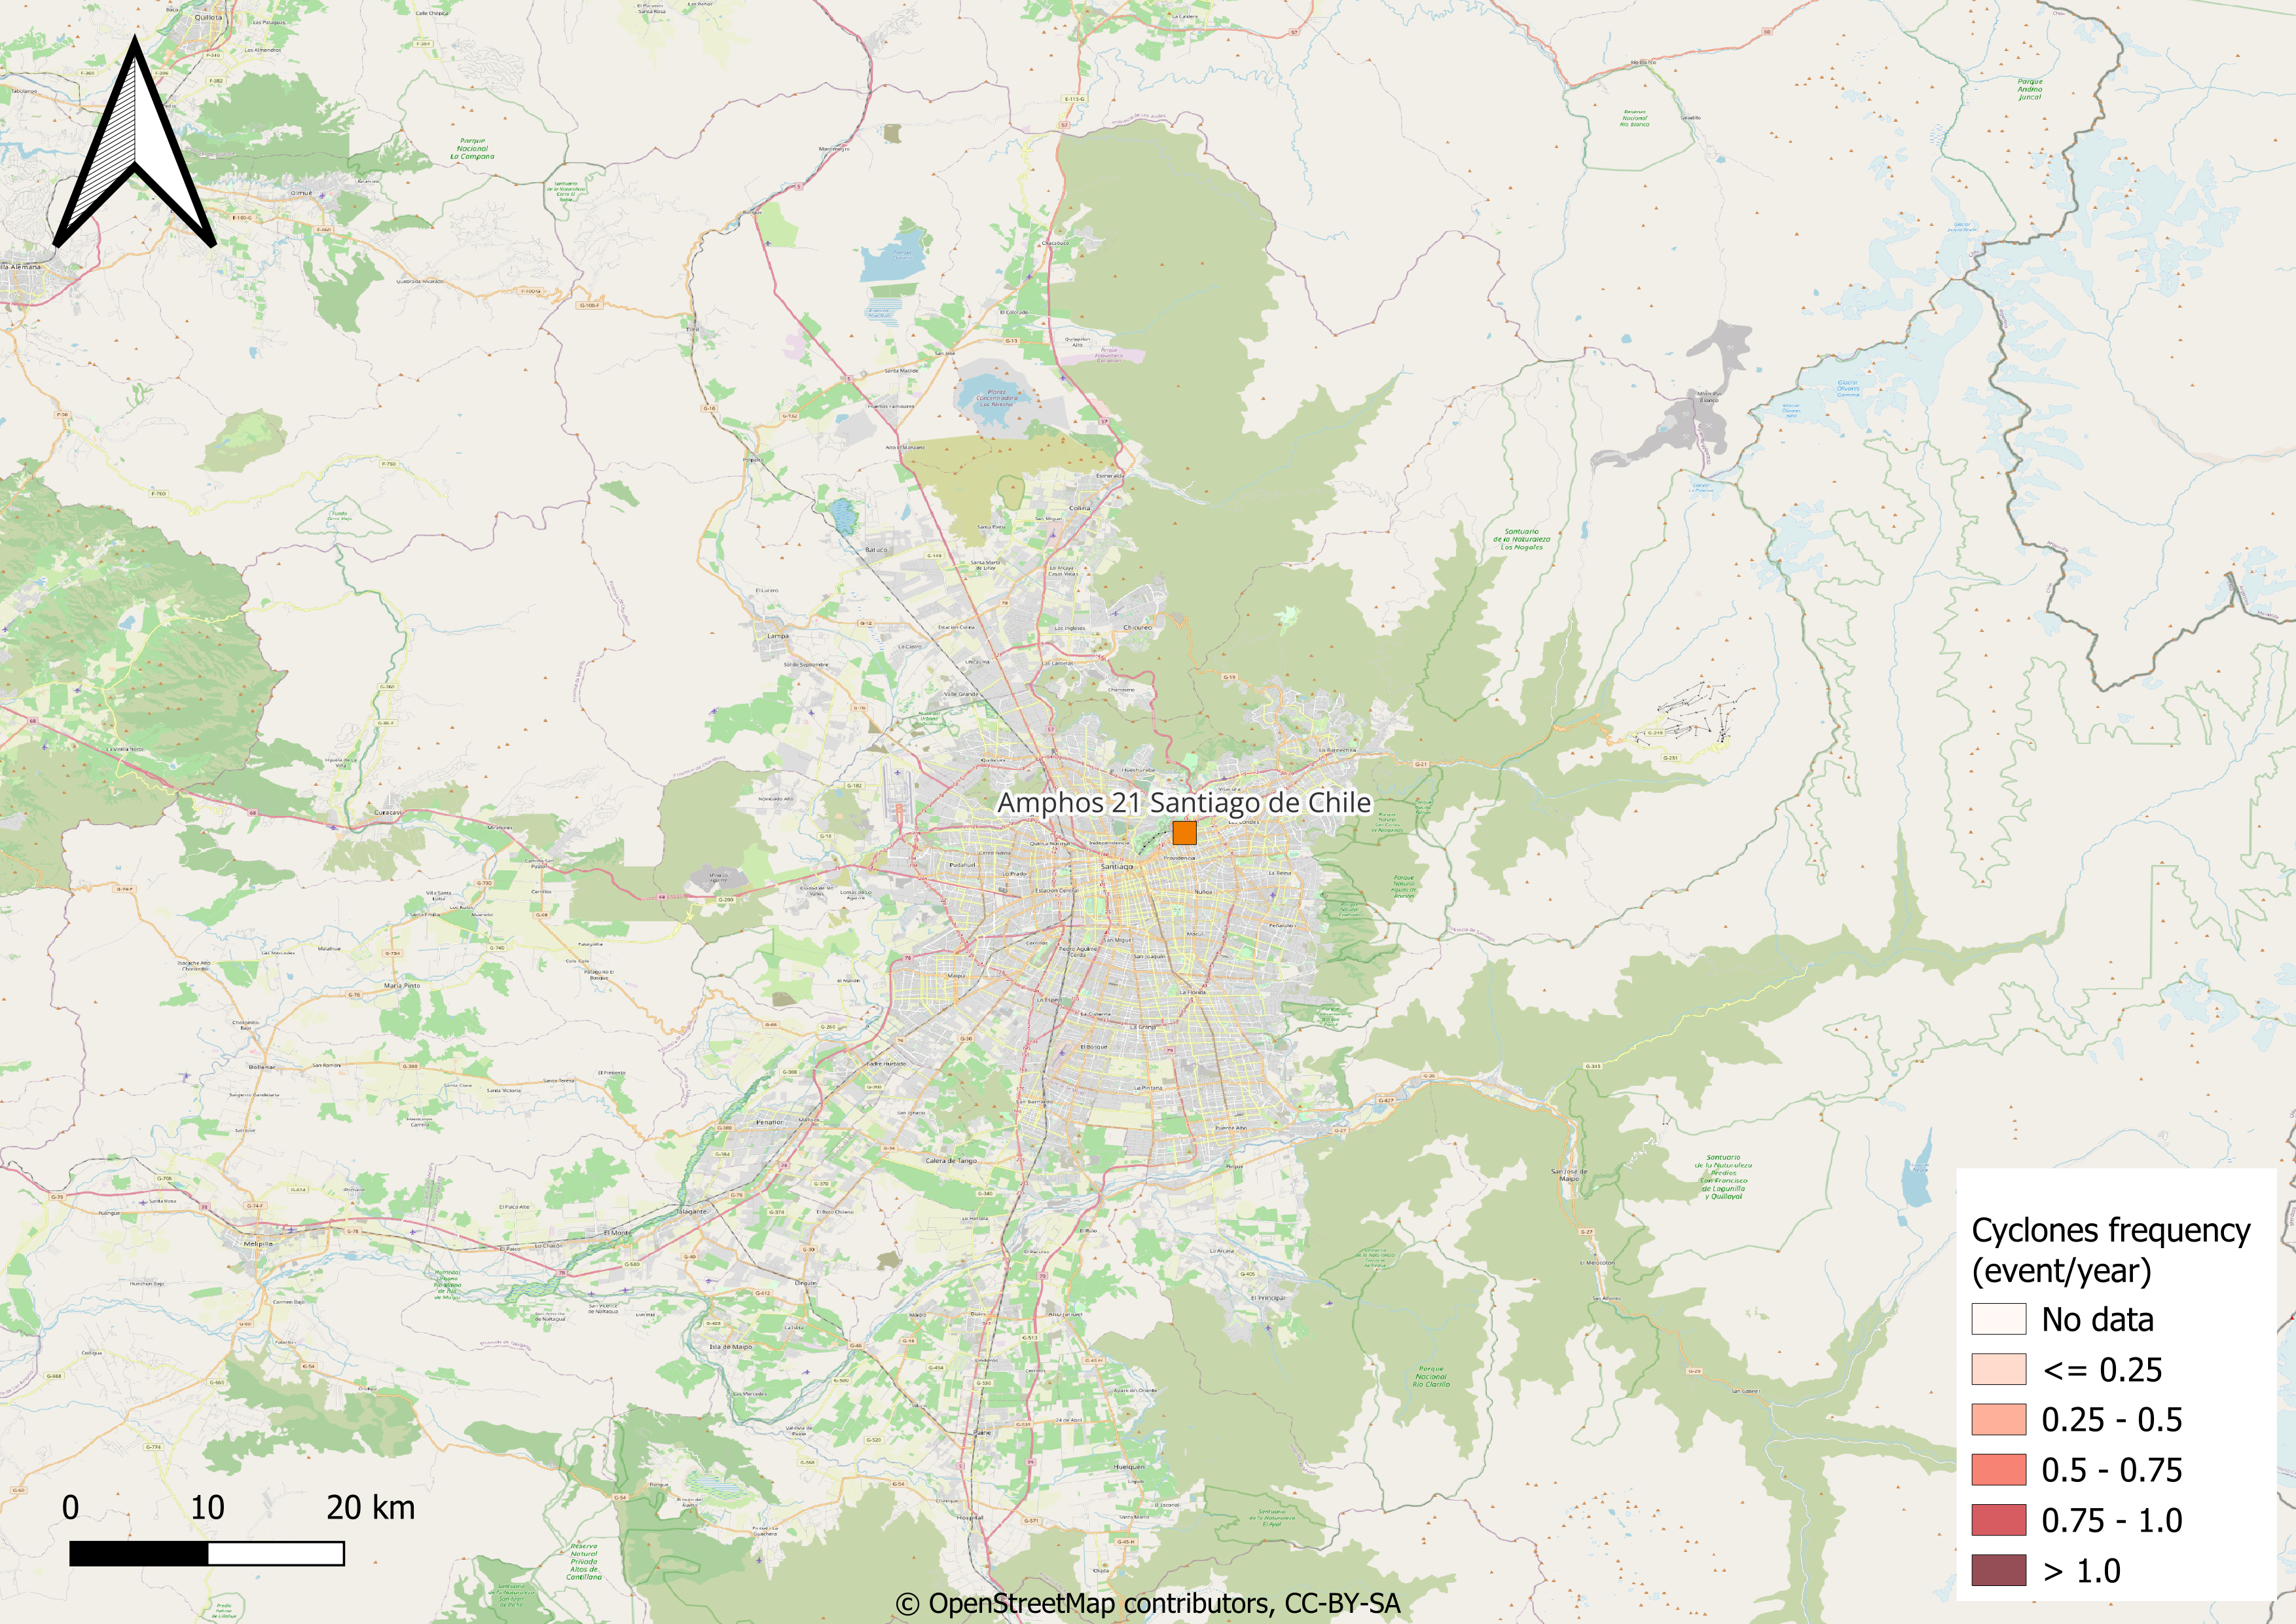
Fig. 21 Tropical cyclones frequency in events per year is an estimate of the tropical cyclone frequency of Saffir-Simpson category 5. Source: IBTrACS processed by UNEP/GRID-Geneva.
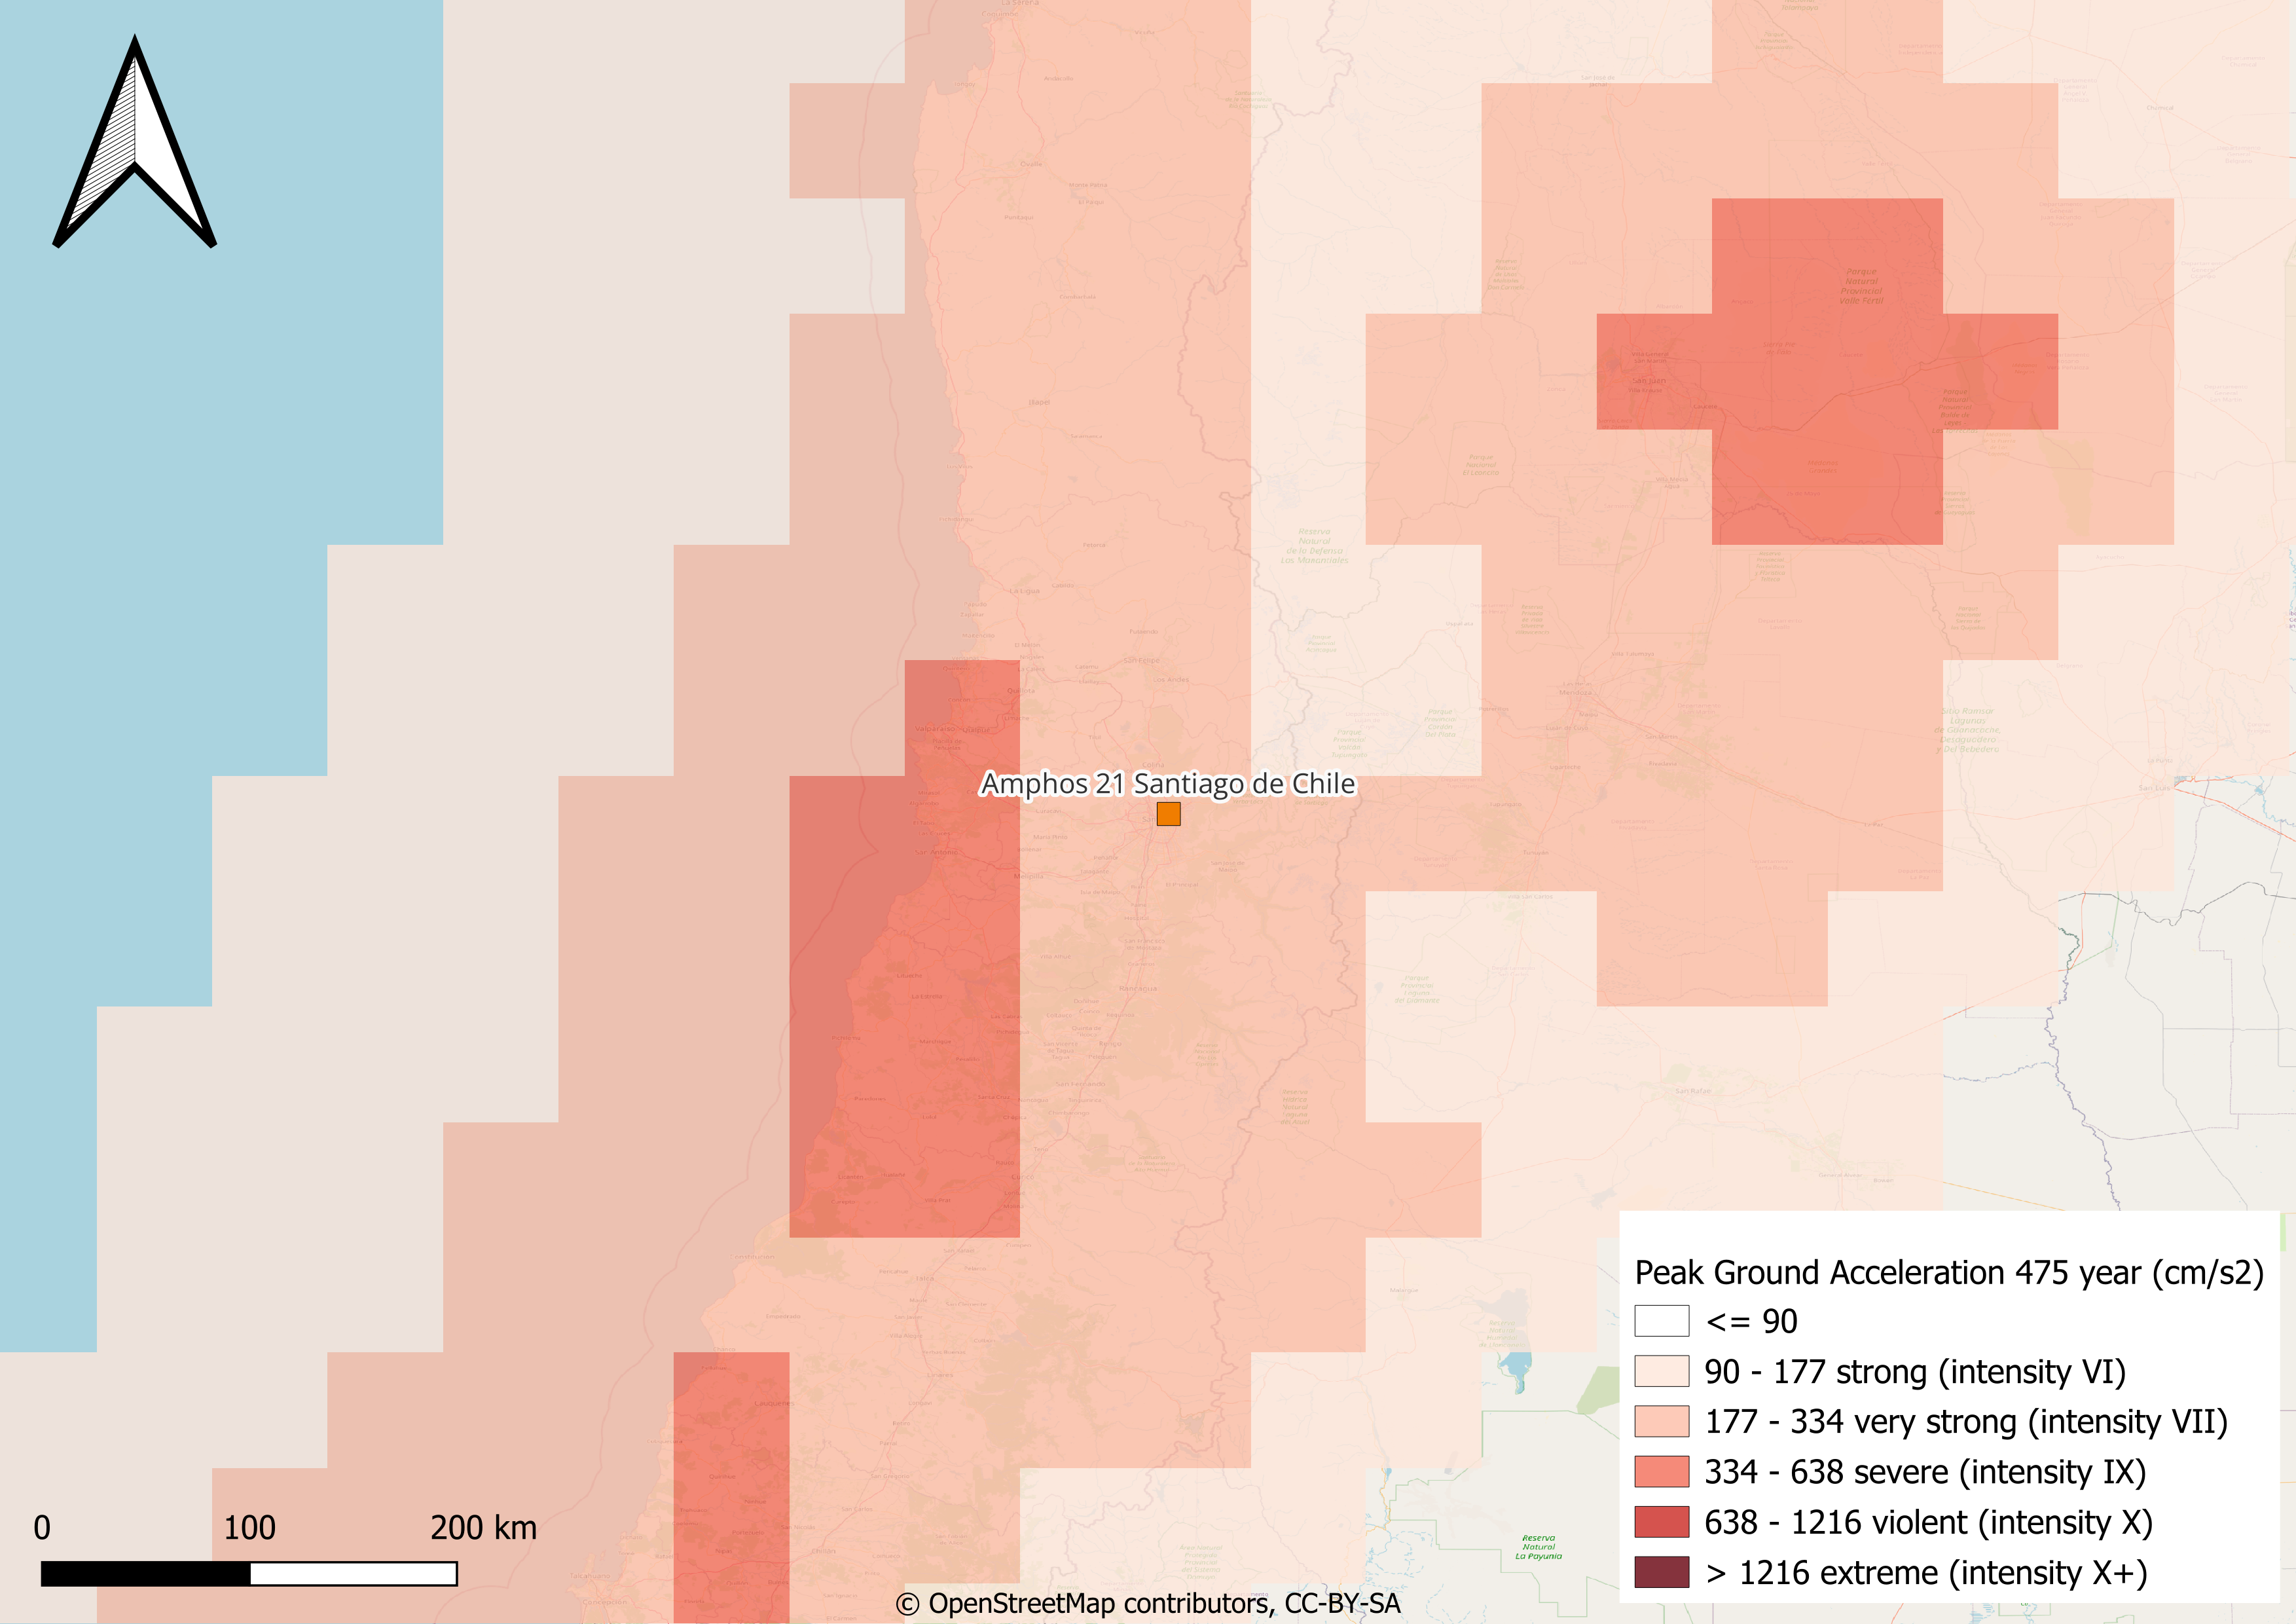
Fig. 22 Estimated Peak Ground Acceleration (PGA) (cm/s2) in a 475 years return period earthquake in Santiago de Chile.
Projected Hazards
The baseline and projected future averaged value of each CID analyzed for this site is presented in the following table. The future projected values for years 2030 and 2050 are displayed for scenario RCP2.6 (green path) and RCP8.5 (unrestricted growth). The temporal evolution of the CID and the mean value for each time period are displayed by clicking on the CID name. Each climate-related hazard is evaluated in a specific section.
Climate Impact-Driver (chart link) |
Units |
Historical |
2030 | 2.6 |
2030 | 8.5 |
2050 | 2.6 |
2050 | 8.5 |
Source |
|---|---|---|---|---|---|---|---|
[-] |
0.5 |
0.5 |
0.5 |
0.4 |
0.5 |
||
days |
78.2 |
69.1 |
65.9 |
77.7 |
79.8 |
||
days |
8.1 |
6.8 |
7.0 |
7.1 |
7.2 |
||
°C |
16.1 |
17.6 |
17.8 |
18.3 |
19.7 |
||
°C |
20.2 |
21.7 |
21.9 |
22.5 |
23.8 |
||
°C |
1.6 |
3.0 |
3.2 |
3.8 |
5.0 |
||
°C |
8.4 |
9.8 |
10.1 |
10.6 |
11.8 |
||
°C |
14.5 |
14.6 |
14.6 |
14.5 |
14.7 |
||
mm yr-1 |
369.5 |
368.3 |
361.6 |
375.9 |
362.0 |
||
days |
114.1 |
78.7 |
73.5 |
61.6 |
40.1 |
||
days |
276.7 |
299.9 |
297.8 |
307.7 |
329.8 |
||
days |
25.5 |
26.3 |
27.6 |
27.8 |
27.2 |
||
days |
10.3 |
5.7 |
5.1 |
3.5 |
1.8 |
||
mm |
66.1 |
70.7 |
71.4 |
72.2 |
79.9 |
||
mm |
157.5 |
175.7 |
171.1 |
185.0 |
184.4 |
||
°C |
33.3 |
34.3 |
34.5 |
35.0 |
35.6 |
||
°C |
14.4 |
15.5 |
15.7 |
16.1 |
16.9 |
||
°C |
-3.0 |
-1.9 |
-1.5 |
-1.2 |
-0.4 |
||
°C |
-18.1 |
-15.4 |
-14.9 |
-15.5 |
-12.3 |
||
°C |
8.4 |
9.9 |
10.1 |
10.6 |
11.8 |
||
°C |
15.4 |
16.8 |
17.1 |
17.6 |
18.8 |
||
m s-1 |
2.2 |
2.2 |
2.2 |
2.2 |
2.2 |
||
days |
59.8 |
62.4 |
62.6 |
61.1 |
59.4 |
||
mm yr-1 |
845.2 |
924.5 |
939.4 |
948.3 |
914.4 |
||
mm yr-1 |
410.0 |
448.4 |
455.6 |
460.0 |
443.6 |
||
mm d-1 |
13.3 |
14.0 |
14.0 |
15.0 |
14.6 |
||
days |
69.2 |
94.0 |
100.4 |
105.9 |
129.6 |
||
mm |
820.3 |
898.0 |
913.5 |
922.2 |
888.9 |
||
mm |
397.9 |
435.6 |
443.1 |
447.3 |
431.2 |
||
days |
0.0 |
0.0 |
0.0 |
0.0 |
0.0 |
||
days |
13.8 |
15.5 |
15.5 |
16.0 |
15.0 |
CIDs with the (bc) suffix correspond to the biased corrected variables. The bias factors and corrections applied are described in the next table. Notice that the model deviation is relevant so modelled data should be taken with care, more as a trend than as a reliable value.
Climate Impact-Driver |
Modelled |
Observed |
Deviation |
Factor |
Delta |
|---|---|---|---|---|---|
Daily maximum near surface air temperature |
16.05 |
20.20 |
-20.53 % |
4.15 °C |
|
Daily minimum near surface air temperature |
1.57 |
8.40 |
-81.35 % |
6.83 °C |
|
Near surface air temperature |
8.43 |
15.40 |
-45.25 % |
6.97 °C |
|
Precipitation |
845.25 |
410.00 |
106.16 % |
0.49 [-] |
Mean temperature
The projected increase in mean temperature is above 9% by 2030 and between 14% and 22% by 2050. This is considered to be a large increase in temperature.
Climate Impact-Driver (chart link) |
Historical |
2030 | 2.6 change |
2030 | 8.5 change |
2050 | 2.6 change |
2050 | 8.5 change |
Source |
|---|---|---|---|---|---|---|
15.4 °C |
Increase |
Large Increase |
Large Increase |
Large Increase |
Extreme Heat
CIDs associated with extreme heat events increase largely for both time periods and scenarios. Considering the current climate of Santiago de Chile, it is possible to become a significant hazard in the future.
Climate Impact-Driver (chart link) |
Historical |
2030 | 2.6 - impact on hazard |
2030 | 8.5 - impact on hazard |
2050 | 2.6 - impact on hazard |
2050 | 8.5 - impact on hazard |
Source |
|---|---|---|---|---|---|---|
20.2 °C |
Increase |
Increase |
Large Increase |
Large Increase |
||
69.2 days |
Large Increase |
Large Increase |
Large Increase |
Large Increase |
||
0.0 days |
No Change |
No Change |
No Change |
No Change |
Cold spells and frosts
Santiago de Chile suffers currently relatively frequent cold spells and frosts hazard episodes. It is projected that they will decrease largely in the future due to the increase of temperatures.
Climate Impact-Driver (chart link) |
Historical |
2030 | 2.6 - impact on hazard |
2030 | 8.5 - impact on hazard |
2050 | 2.6 - impact on hazard |
2050 | 8.5 - impact on hazard |
Source |
|---|---|---|---|---|---|---|
114.1 days |
Large Decrease |
Large Decrease |
Large Decrease |
Large Decrease |
||
10.3 days |
Large Decrease |
Large Decrease |
Large Decrease |
Large Decrease |
Mean precipitation
An increase is projected in mean annual precipitation. These changes may be taken carefully due to the model bias.
Climate Impact-Driver (chart link) |
Historical |
2030 | 2.6 change |
2030 | 8.5 change |
2050 | 2.6 change |
2050 | 8.5 change |
Source |
|---|---|---|---|---|---|---|
410.0 mm yr-1 |
Increase |
Large Increase |
Large Increase |
Increase |
Floods and landslides
All CIDs associated with flood and landslide hazards are projected to increase for 2030 period and largely increase 2050 time period.
As stated in the baseline, the facility is located in an area with current flooding risk.
Climate Impact-Driver (chart link) |
Historical |
2030 | 2.6 - impact on hazard |
2030 | 8.5 - impact on hazard |
2050 | 2.6 - impact on hazard |
2050 | 8.5 - impact on hazard |
Source |
|---|---|---|---|---|---|---|
25.5 days |
No Change |
Increase |
Increase |
Increase |
||
66.1 mm |
Increase |
Increase |
Increase |
Large Increase |
||
157.5 mm |
Large Increase |
Increase |
Large Increase |
Large Increase |
||
13.8 days |
Large Increase |
Large Increase |
Large Increase |
Increase |
Aridity
In the mid-term, a moderate decrease in related CIDs are projected in aridity. In the long-term, aridity presents also some decrease.
Climate Impact-Driver (chart link) |
Historical |
2030 | 2.6 - impact on hazard |
2030 | 8.5 - impact on hazard |
2050 | 2.6 - impact on hazard |
2050 | 8.5 - impact on hazard |
Source |
|---|---|---|---|---|---|---|
0.5 [-] |
Decrease |
No Change |
Large Decrease |
Decrease |
||
78.2 days |
Large Decrease |
Large Decrease |
No Change |
No Change |
Drought
A decrease are projected in drought at the mid-term. At the long-term, no change drought hazard is projected.
Climate Impact-Driver (chart link) |
Historical |
2030 | 2.6 - impact on hazard |
2030 | 8.5 - impact on hazard |
2050 | 2.6 - impact on hazard |
2050 | 8.5 - impact on hazard |
Source |
|---|---|---|---|---|---|---|
78.2 days |
Large Decrease |
Large Decrease |
No Change |
No Change |
||
59.8 days |
No Change |
No Change |
No Change |
No Change |
Wildfire
No decrease in wildfire hazard is projected for both scenarios at the mid-term and long term, mainly by the decrease of the near surface wind speed.
Climate Impact-Driver (chart link) |
Historical |
2030 | 2.6 - impact on hazard |
2030 | 8.5 - impact on hazard |
2050 | 2.6 - impact on hazard |
2050 | 8.5 - impact on hazard |
Source |
|---|---|---|---|---|---|---|
78.2 days |
Large Decrease |
Large Decrease |
No Change |
No Change |
||
2.2 m s-1 |
No Change |
No Change |
No Change |
No Change |
||
59.8 days |
No Change |
No Change |
No Change |
No Change |
Coastal flood
Located at an altitude of 570 above sea level, no coastal flooding risk is projected in the future.
Conclusions
This section summarizes the climate-related physical hazards at the Santiago de Chile facility. The projected future evolution of the hazards is graded between a large decrease to a large increase in the hazard. Some of the hazards are non relevant for a site. In Santiago de Chile the coastal flood can be disregarded.
Santiago de Chile is projected to suffer a large increase in mean temperature. This variation leads to a increase in potential physical risk associated with extreme heat events. However, this extreme heat hazard increase may not have very significant impacts considering the baseline climate conditions of Santiago de Chile (not base high temperatures). The cold spells and frosts hazard events are projected to decrease largely..
The mean annual precipitation is projected to increase. It will change, however, how this precipitation will fall. The maximum 1 and 5 days precipitation and very heavy precipitations are projected to increase largely leading to an increase in flood and landslide hazards. The number of consecutive dry days is projected to decrease in the mid-term, leading to a projected decrease of aridity, drought and wildfire in that period.
Hazard |
2030 | 2.6 - Estimated Physical Risk Change |
2030 | 8.5 - Estimated Physical Risk Change |
2050 | 2.6 - Estimated Physical Risk Change |
2050 | 8.5 - Estimated Physical Risk Change |
|---|---|---|---|---|
Extreme heat |
Increase |
Increase |
Increase |
Increase |
Cold spell and frost |
Large Decrease |
Large Decrease |
Large Decrease |
Large Decrease |
Floods |
Increase |
Increase |
Large Increase |
Large Increase |
Landslide |
Increase |
Increase |
Large Increase |
Large Increase |
Aridity |
Large Decrease |
Decrease |
Decrease |
Decrease |
Drought |
Decrease |
Decrease |
No Change |
No Change |
Wildfire |
Decrease |
Decrease |
No Change |
No Change |
Coastal flood |
No Relevant |
No Relevant |
No Relevant |
No Relevant |
Wind |
No Change |
No Change |
No Change |
No Change |