RSK Sydney
Background
Sydney is located on the Australia’s East Coast coastal, with the Tasman Sea to the east, the Blue Mountains to the west, the Hawkesbury River to the north, and the Woronora Plateau to the south. The RSK office in Sydney is located at an elevation of approximately 90 m above the sea level.
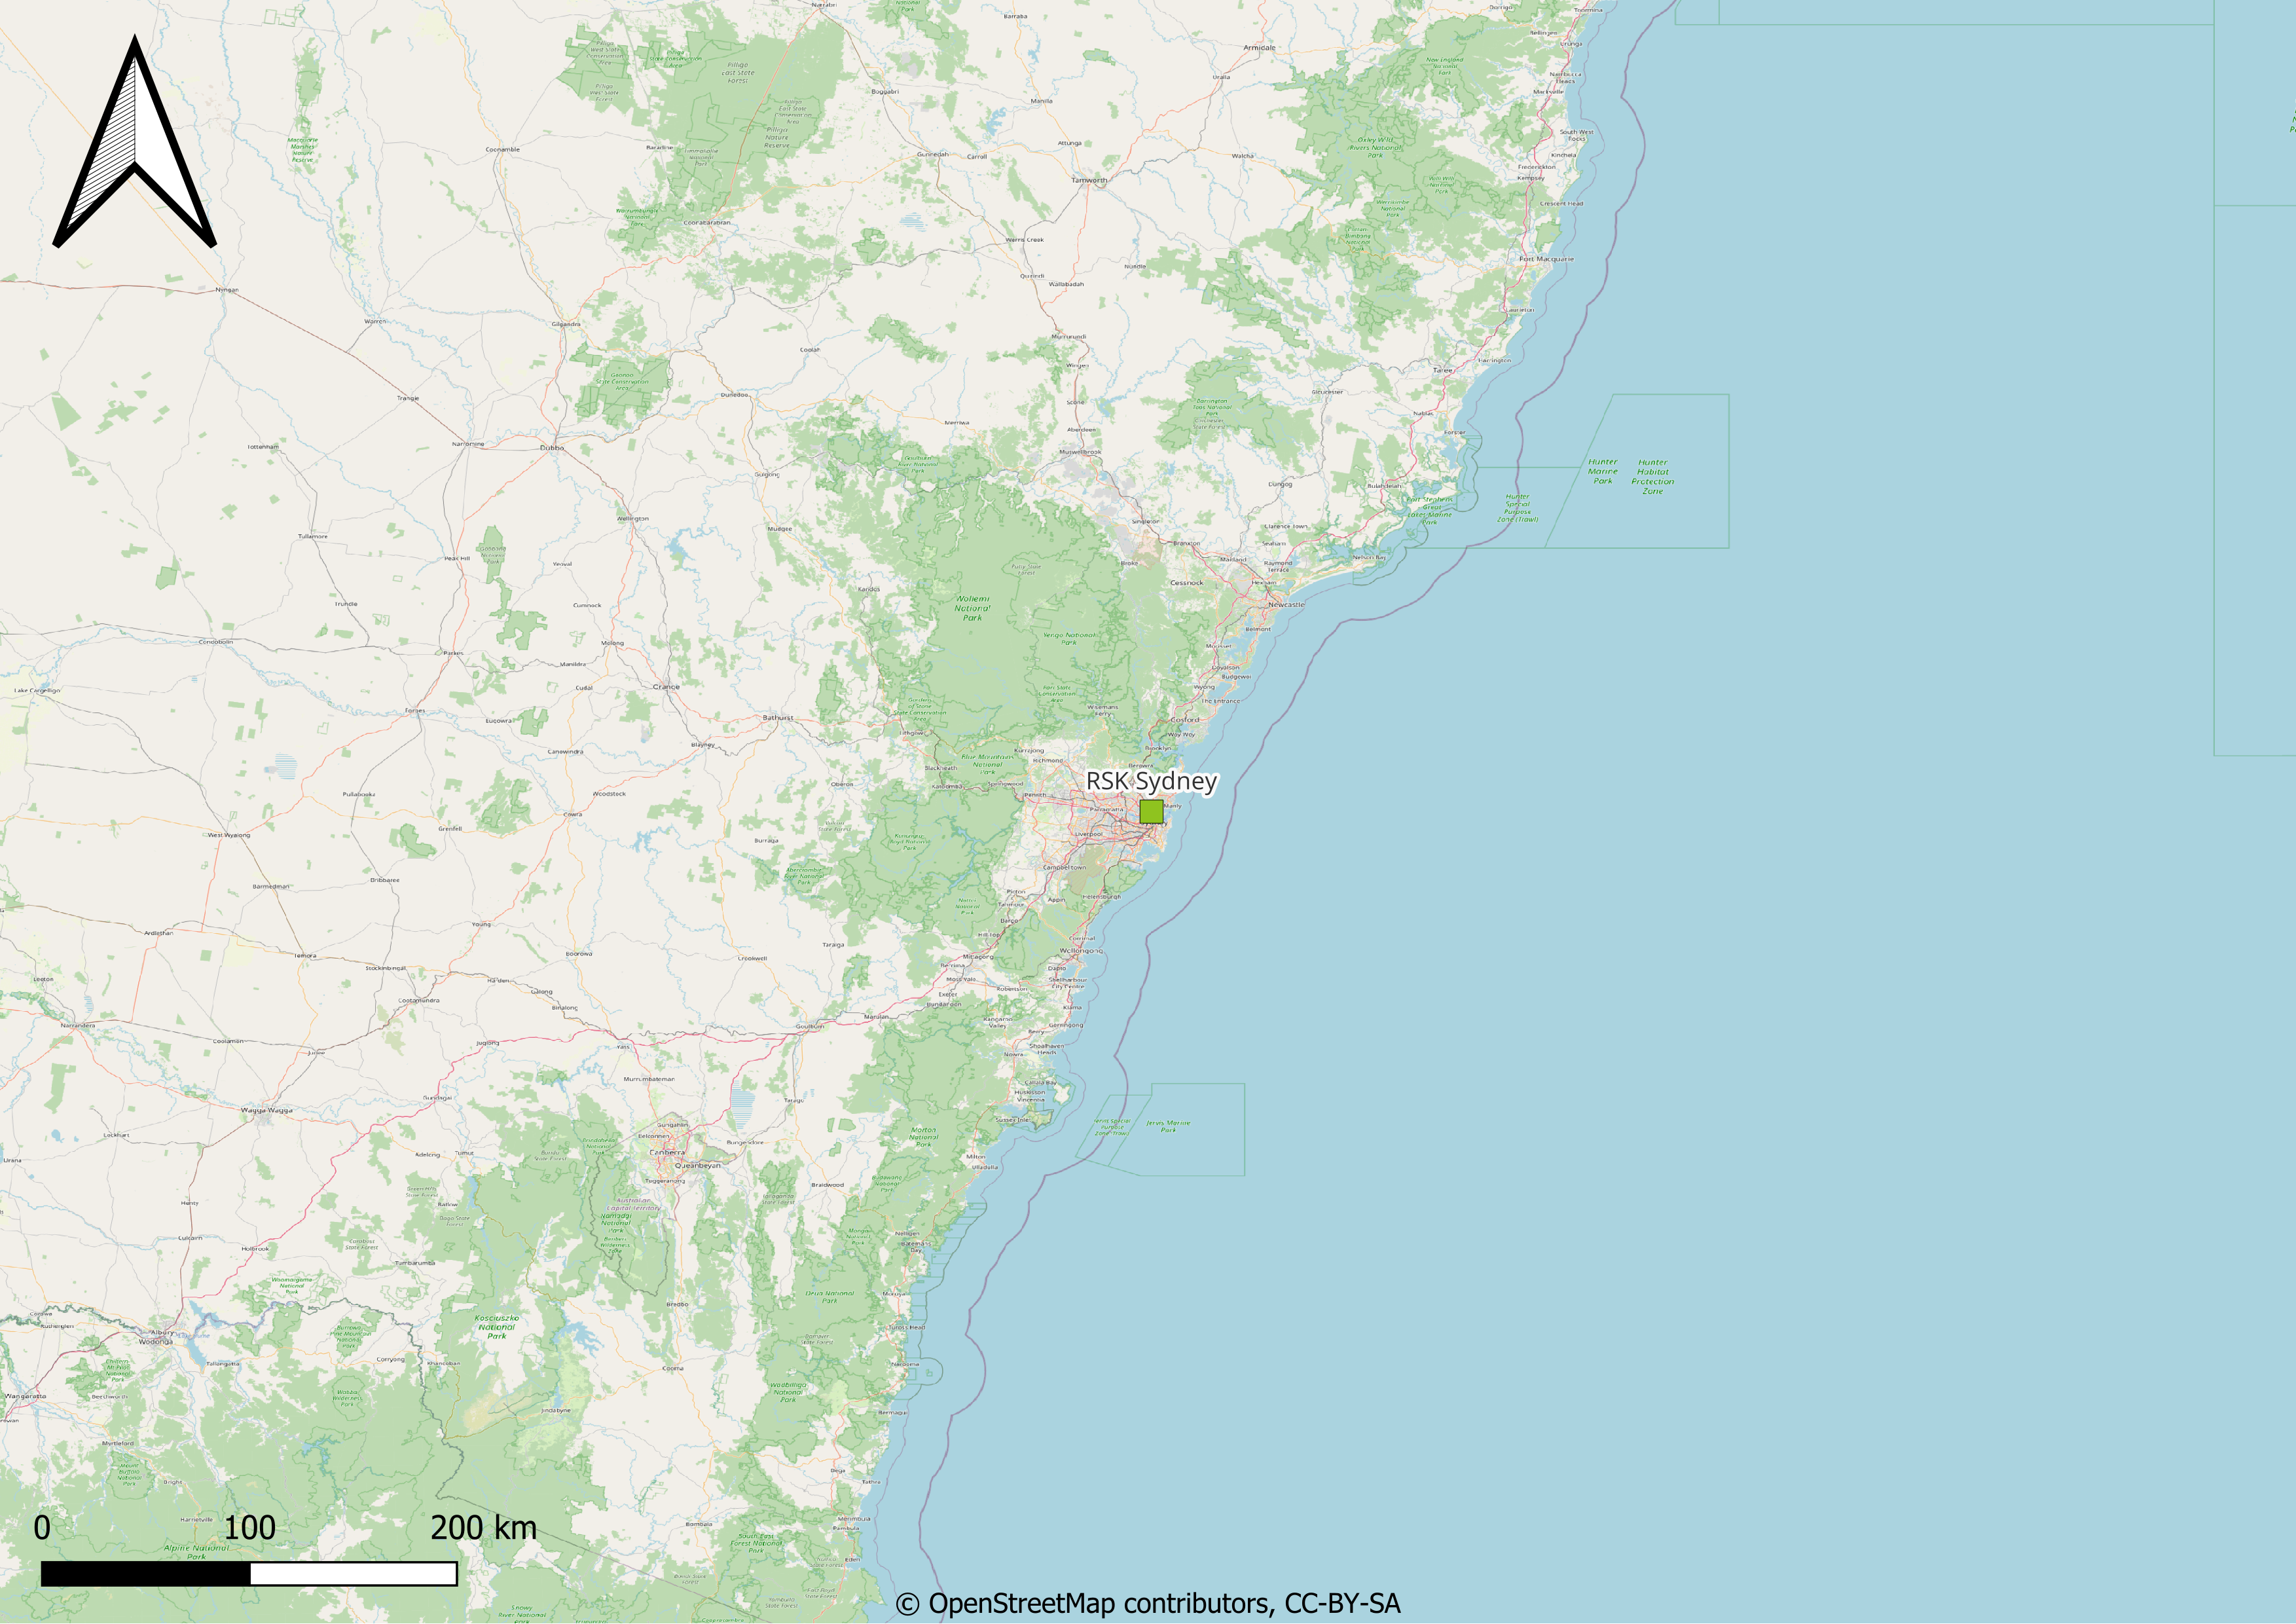
Location of the RSK office in Sidney.
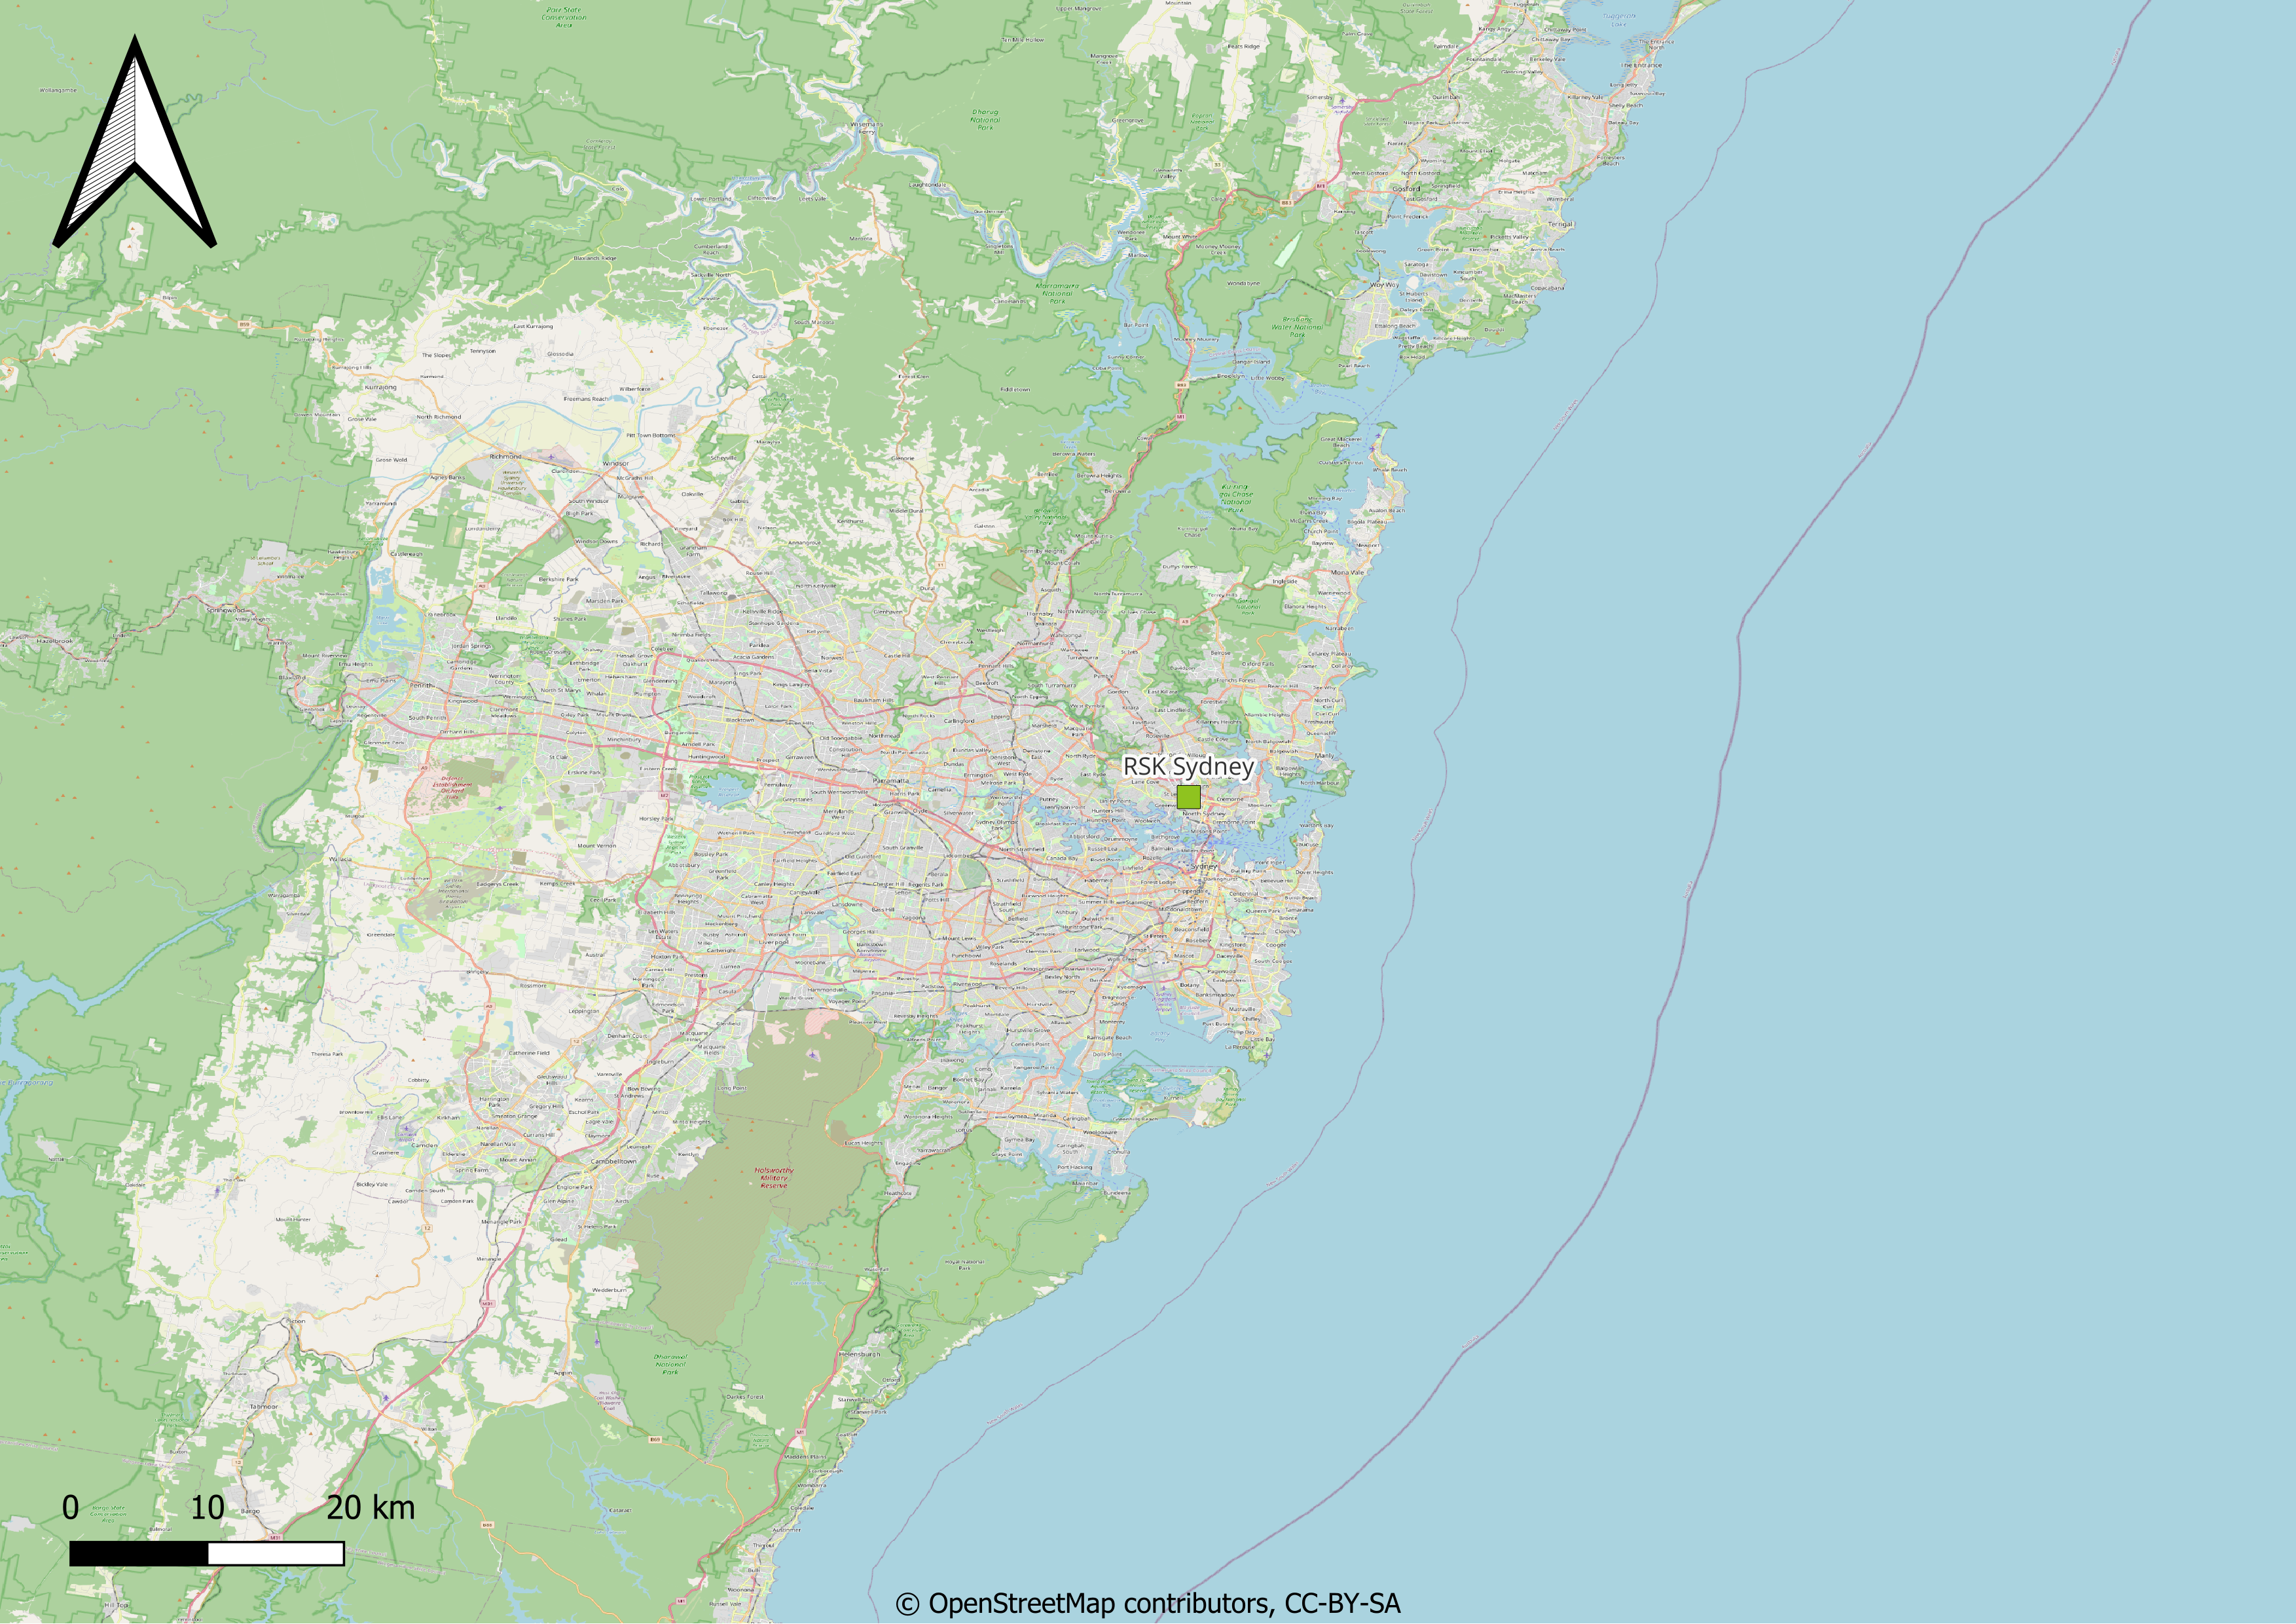
Detailed location of the RSK office in Sidney.
Natural risk past events
Current Baseline
Sydney has a humid subtropical climate (Cfa), with cool winters and warm to hot summers, while the rainiest season is spring, even though precipitations are quite regular along the year.
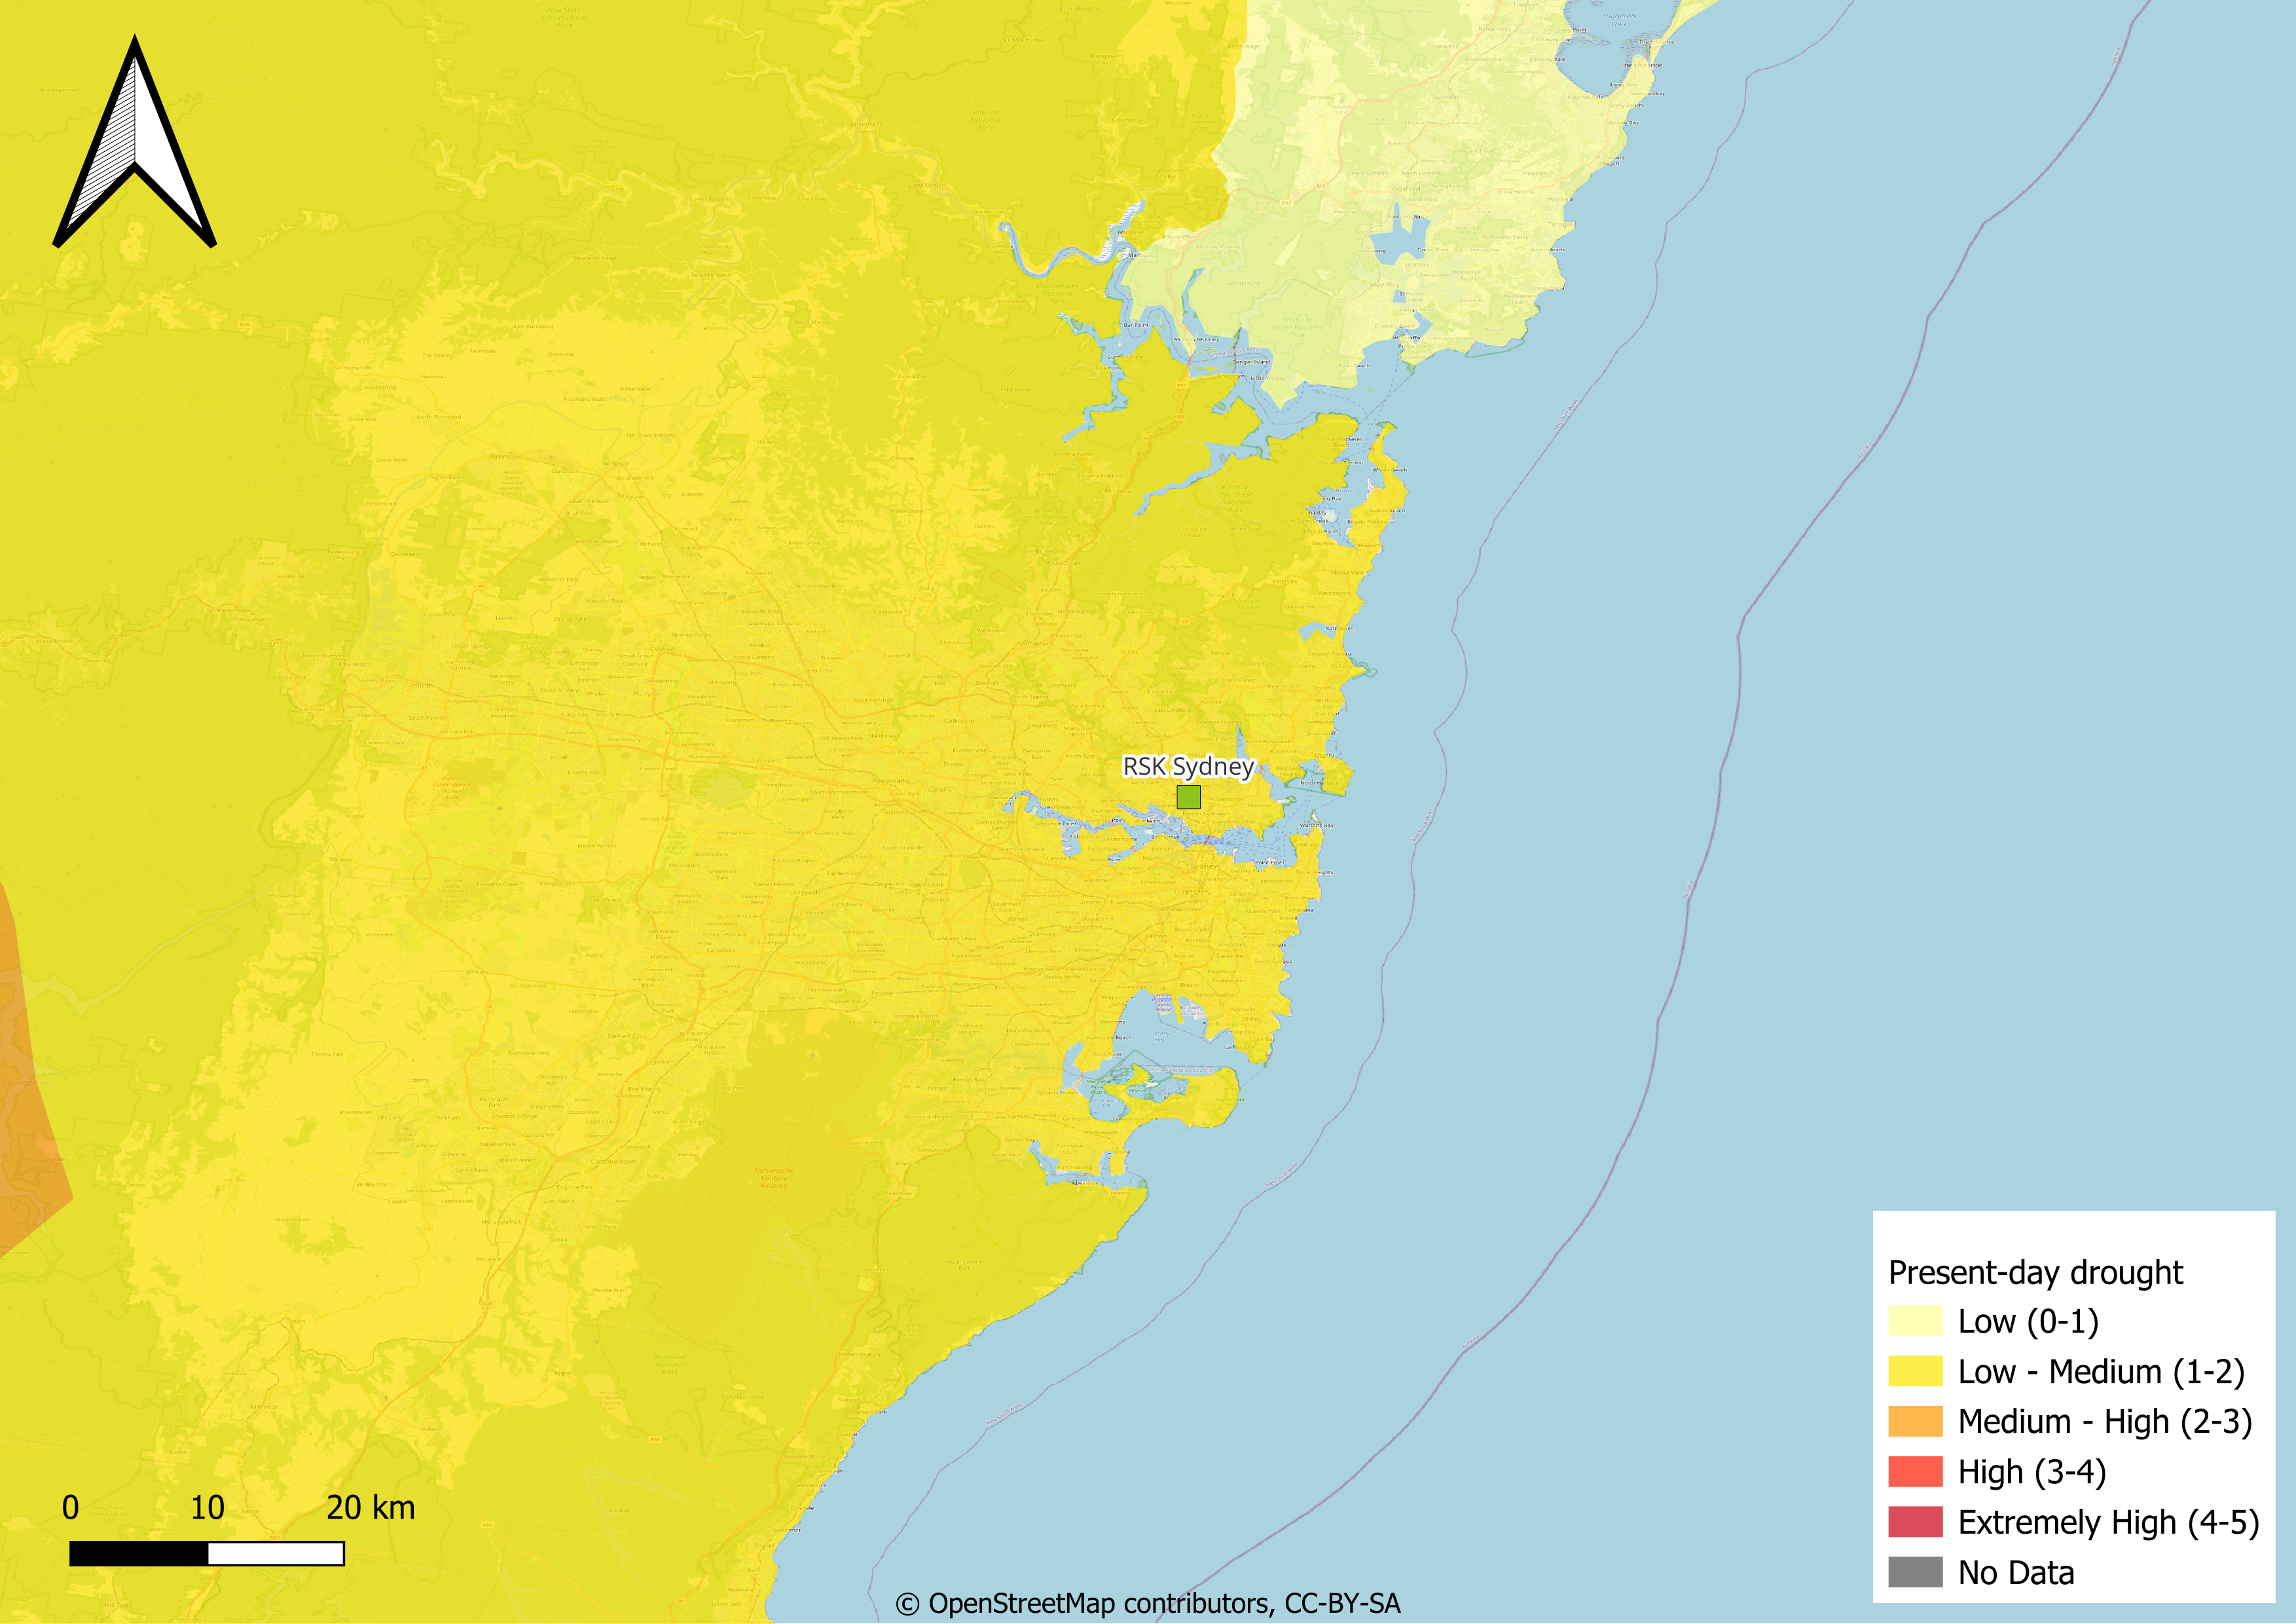
The current water stress of the Sydney region is medium-high and has a low drought risk. Some parts of Sydney, and in particular the southern neighbourhoods of the city, including the airport area, are currently affected by river floodings, with potential limitations to traffic and products and services delivery. As for landslides, Sydney is not affected by this hazards, with the exception of the surrounding natural areas to the North, West and South. The city of Sydney, like the rest of the country, is exposed to low to medium earthquake hazard.
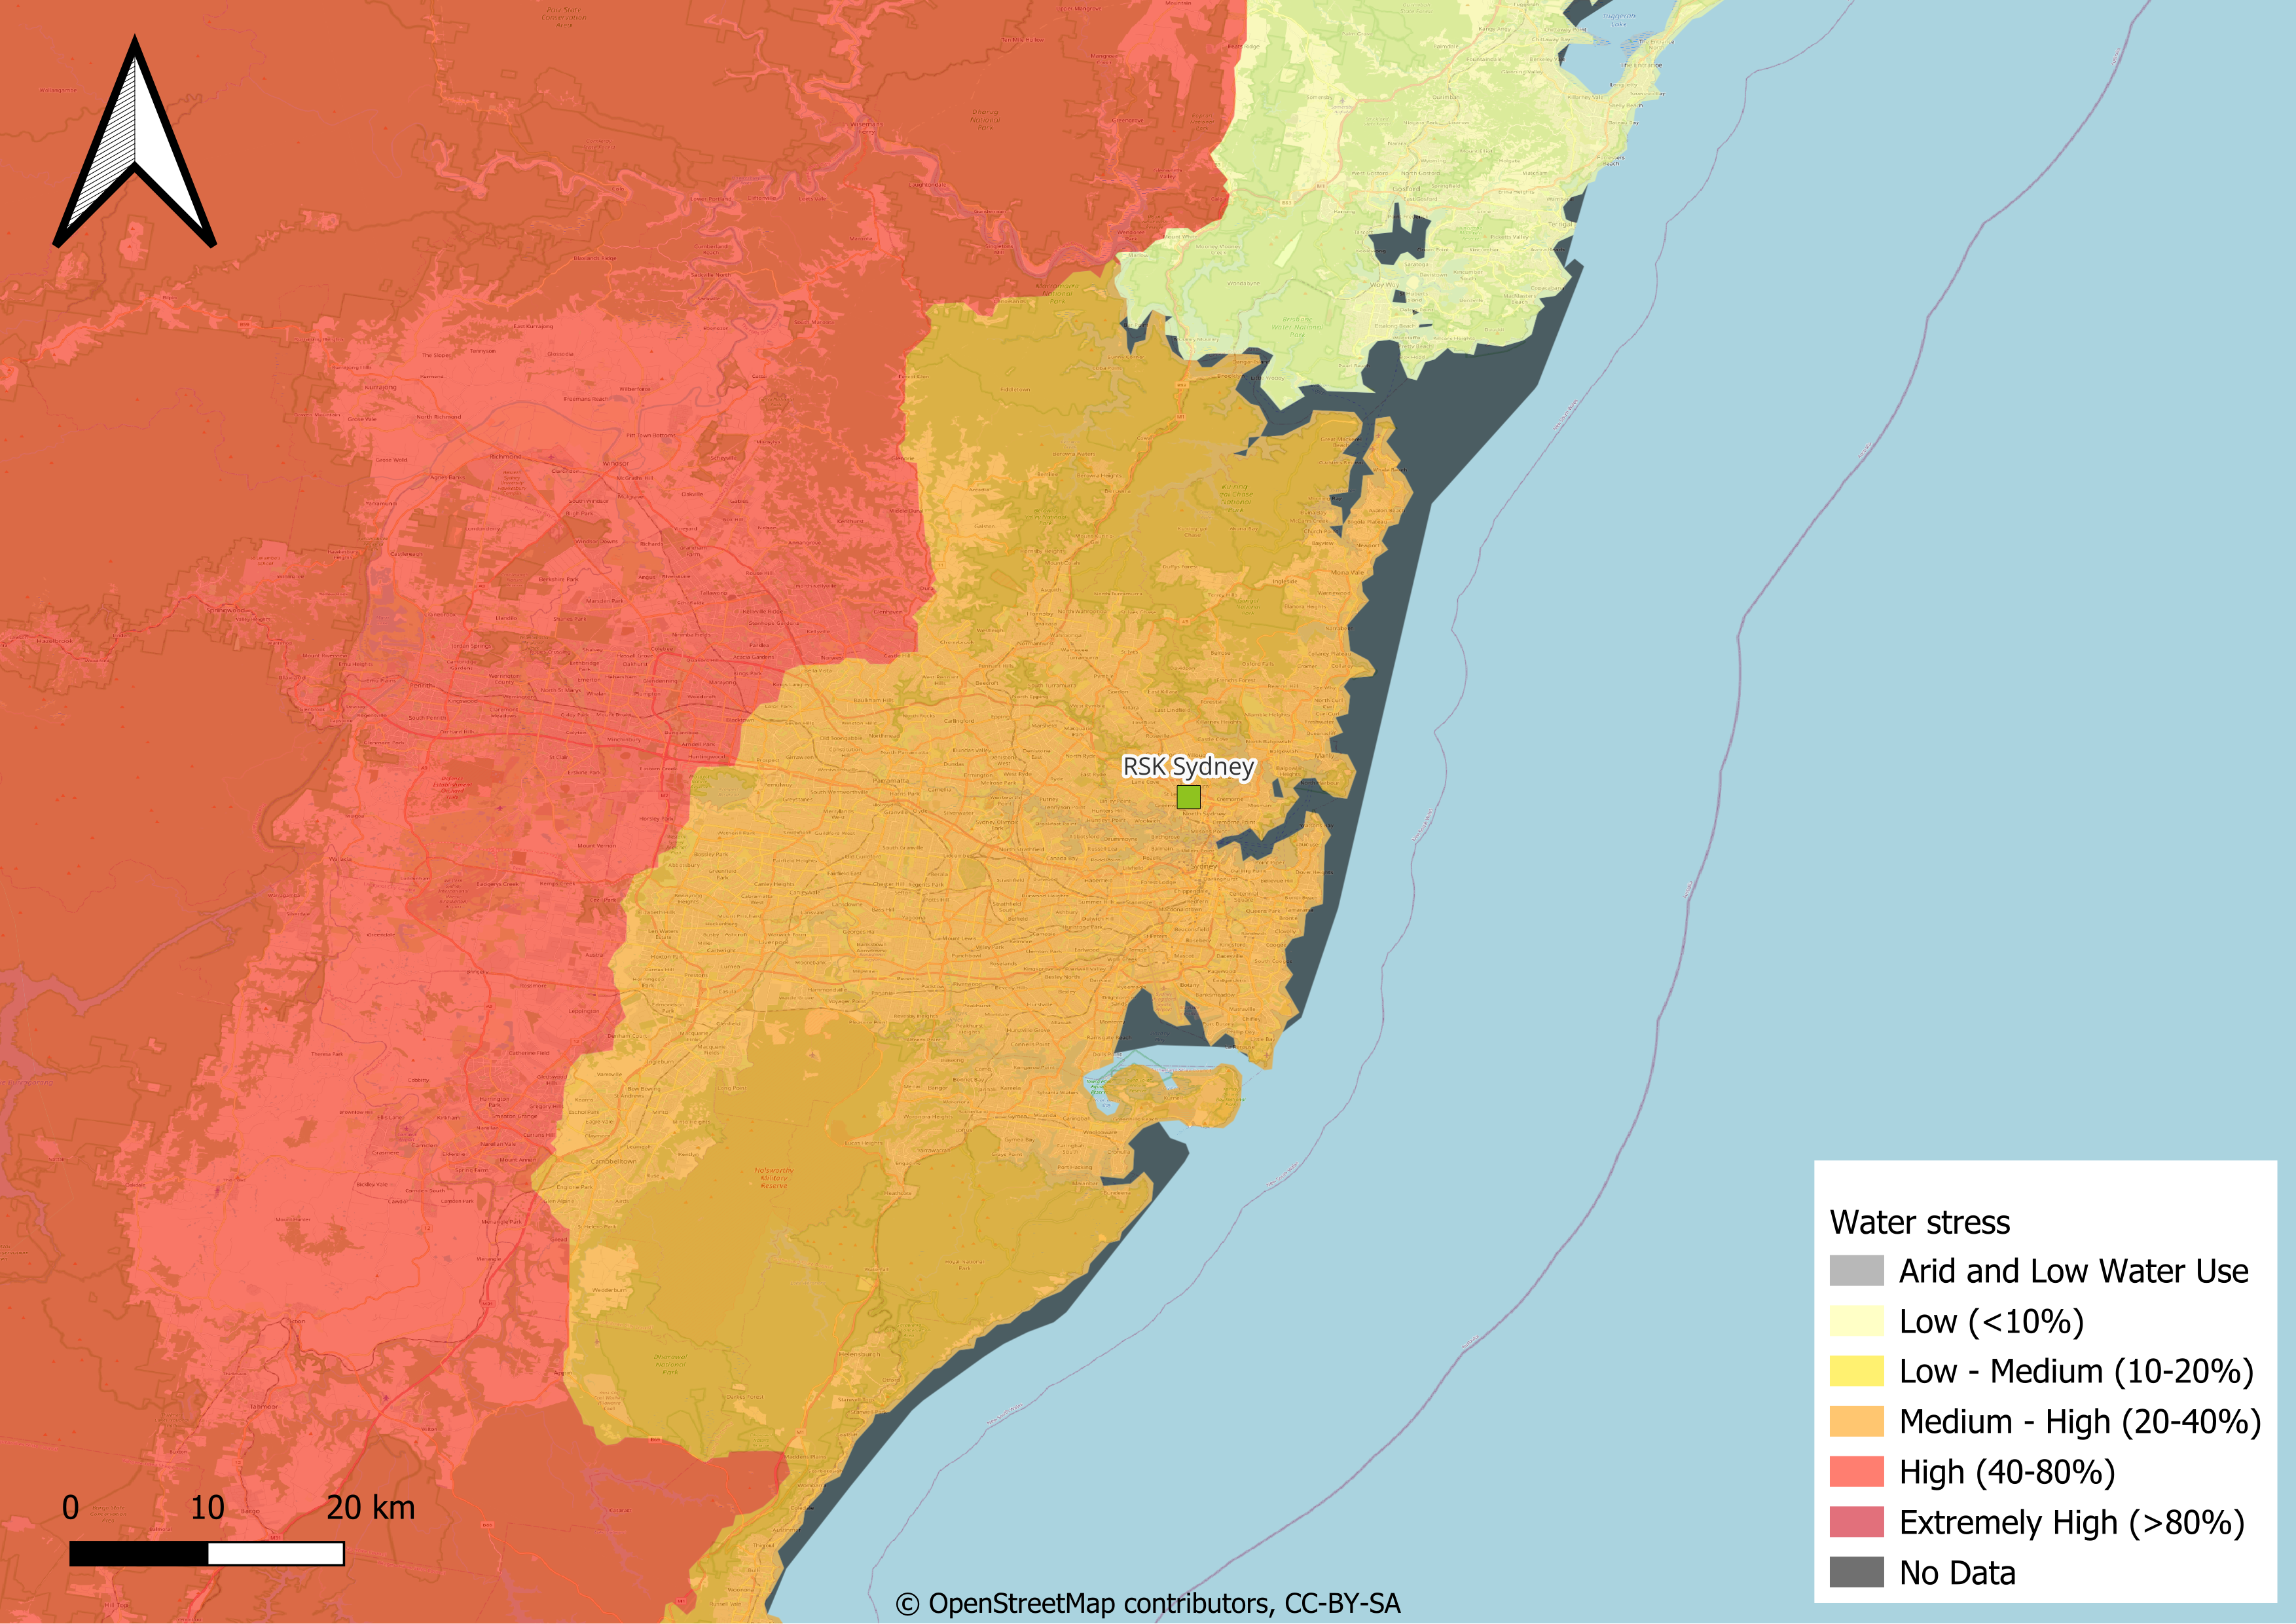
Present-day water stress in Sidney. Source: Aqueduct.
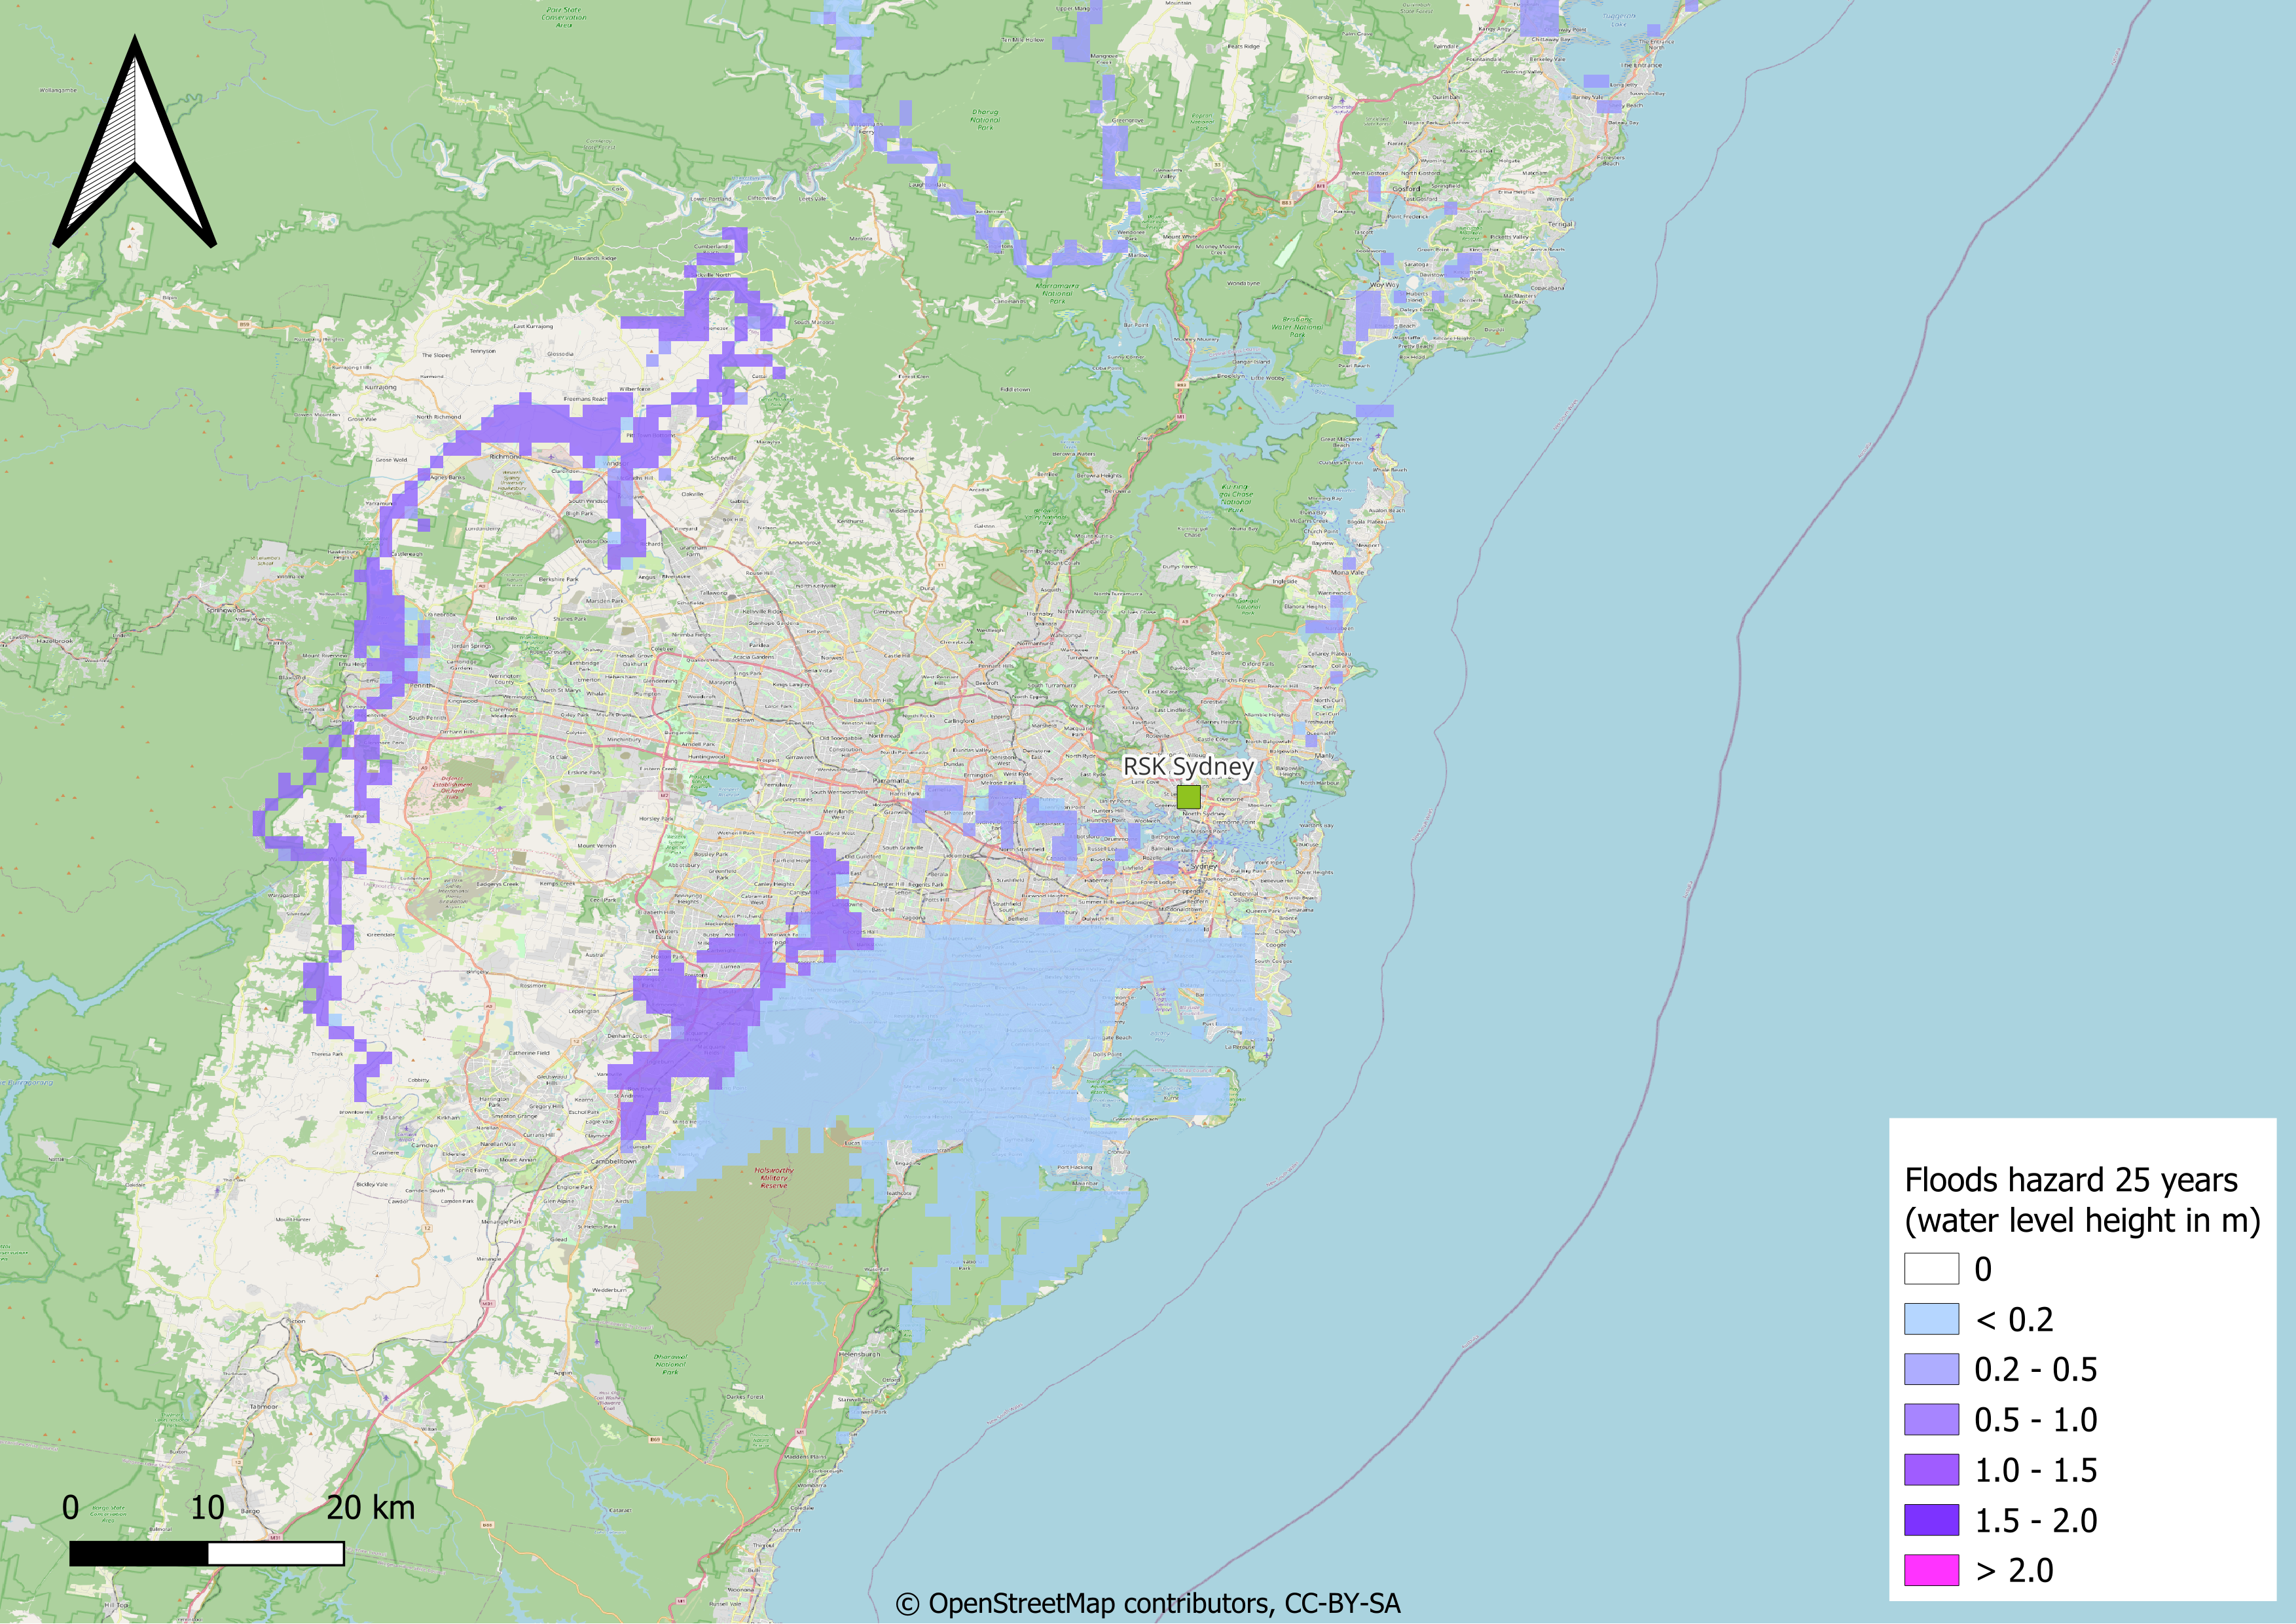
Present-day flood hazard in a 25 years return period in Sidney. The values are expected water level high in meters. The return period indicates that the flood of this magnitude is expected once every 25 years. Source: WRI - Aqueduct Floods.
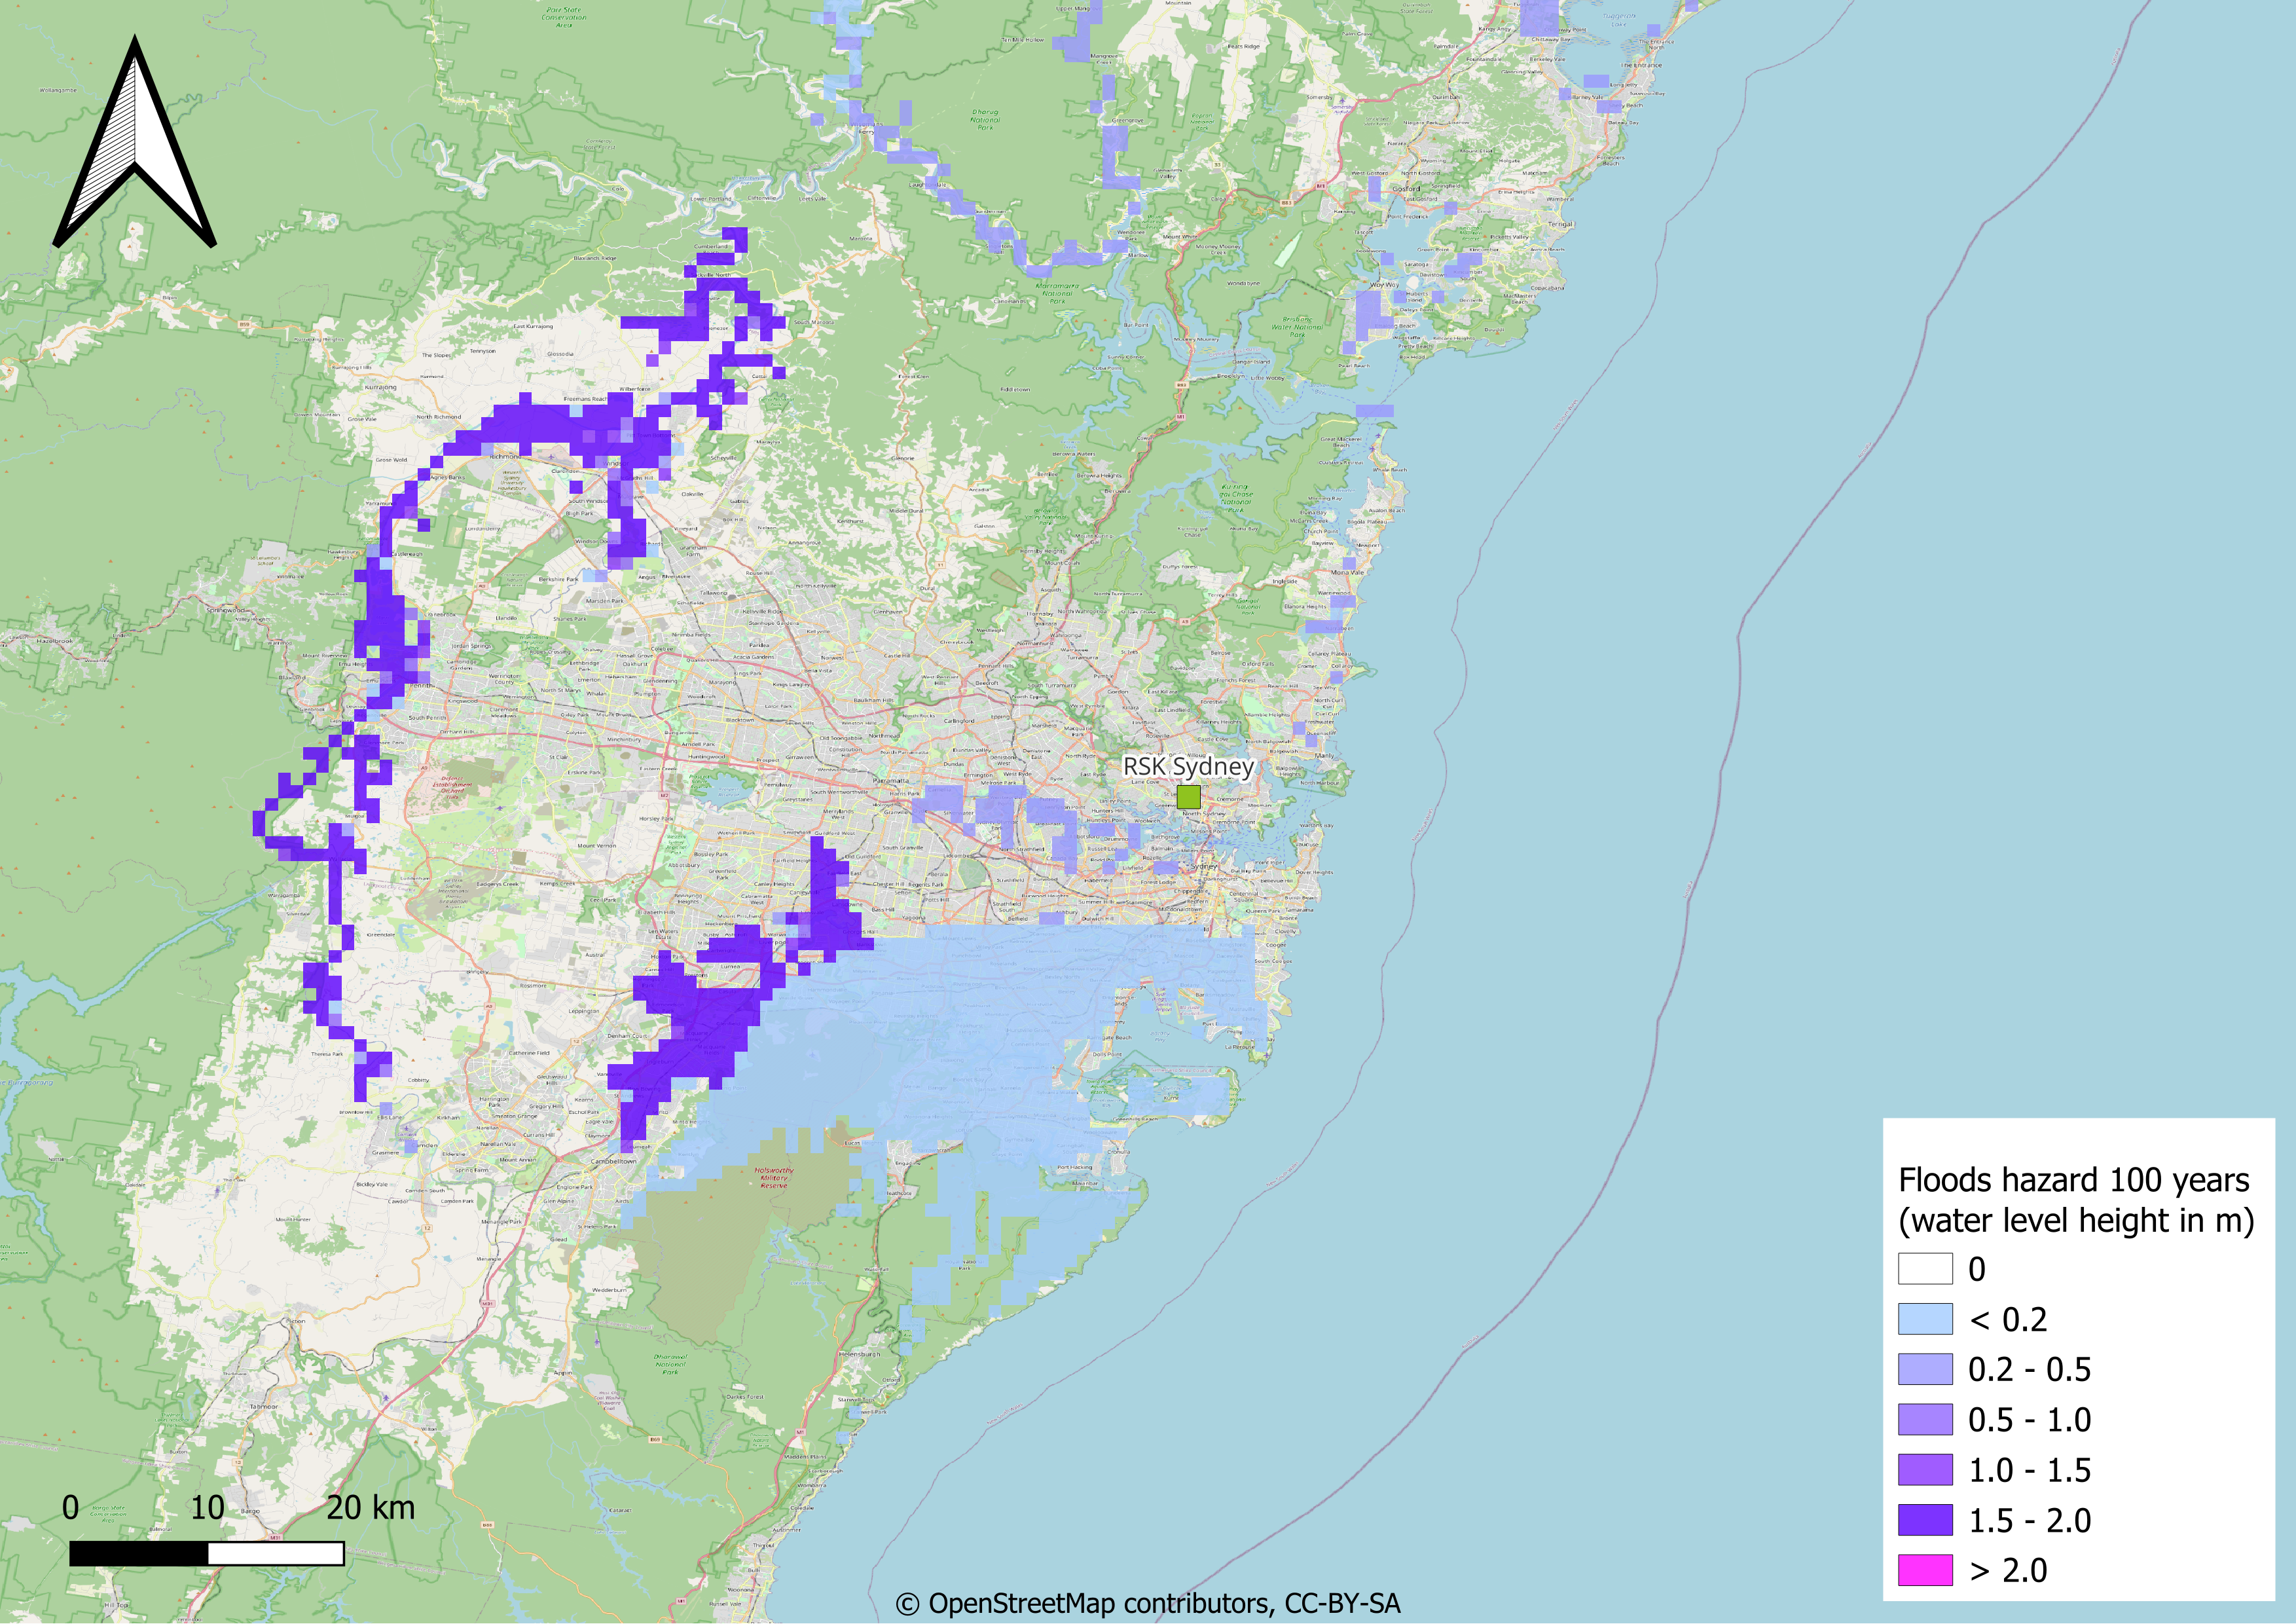
Present-day flood hazard in a 100 years return period in Sidney. The values are expected water level high in meters. The return period indicates that the flood of this magnitude is expected once every 100 years. Source: WRI - Aqueduct Floods.

Present-day flood hazard in a 250 years return period in Sidney. The values are expected water level high in meters. The return period indicates that the flood of this magnitude is expected once every 250 years. Source: WRI - Aqueduct Floods.

Present-day frequency of landslides triggered by precipitation meassured in expected annual probability and percentage of pixel of occurrence of a potentially destructive landslide event x 1000000. Source Global Assessment Report.
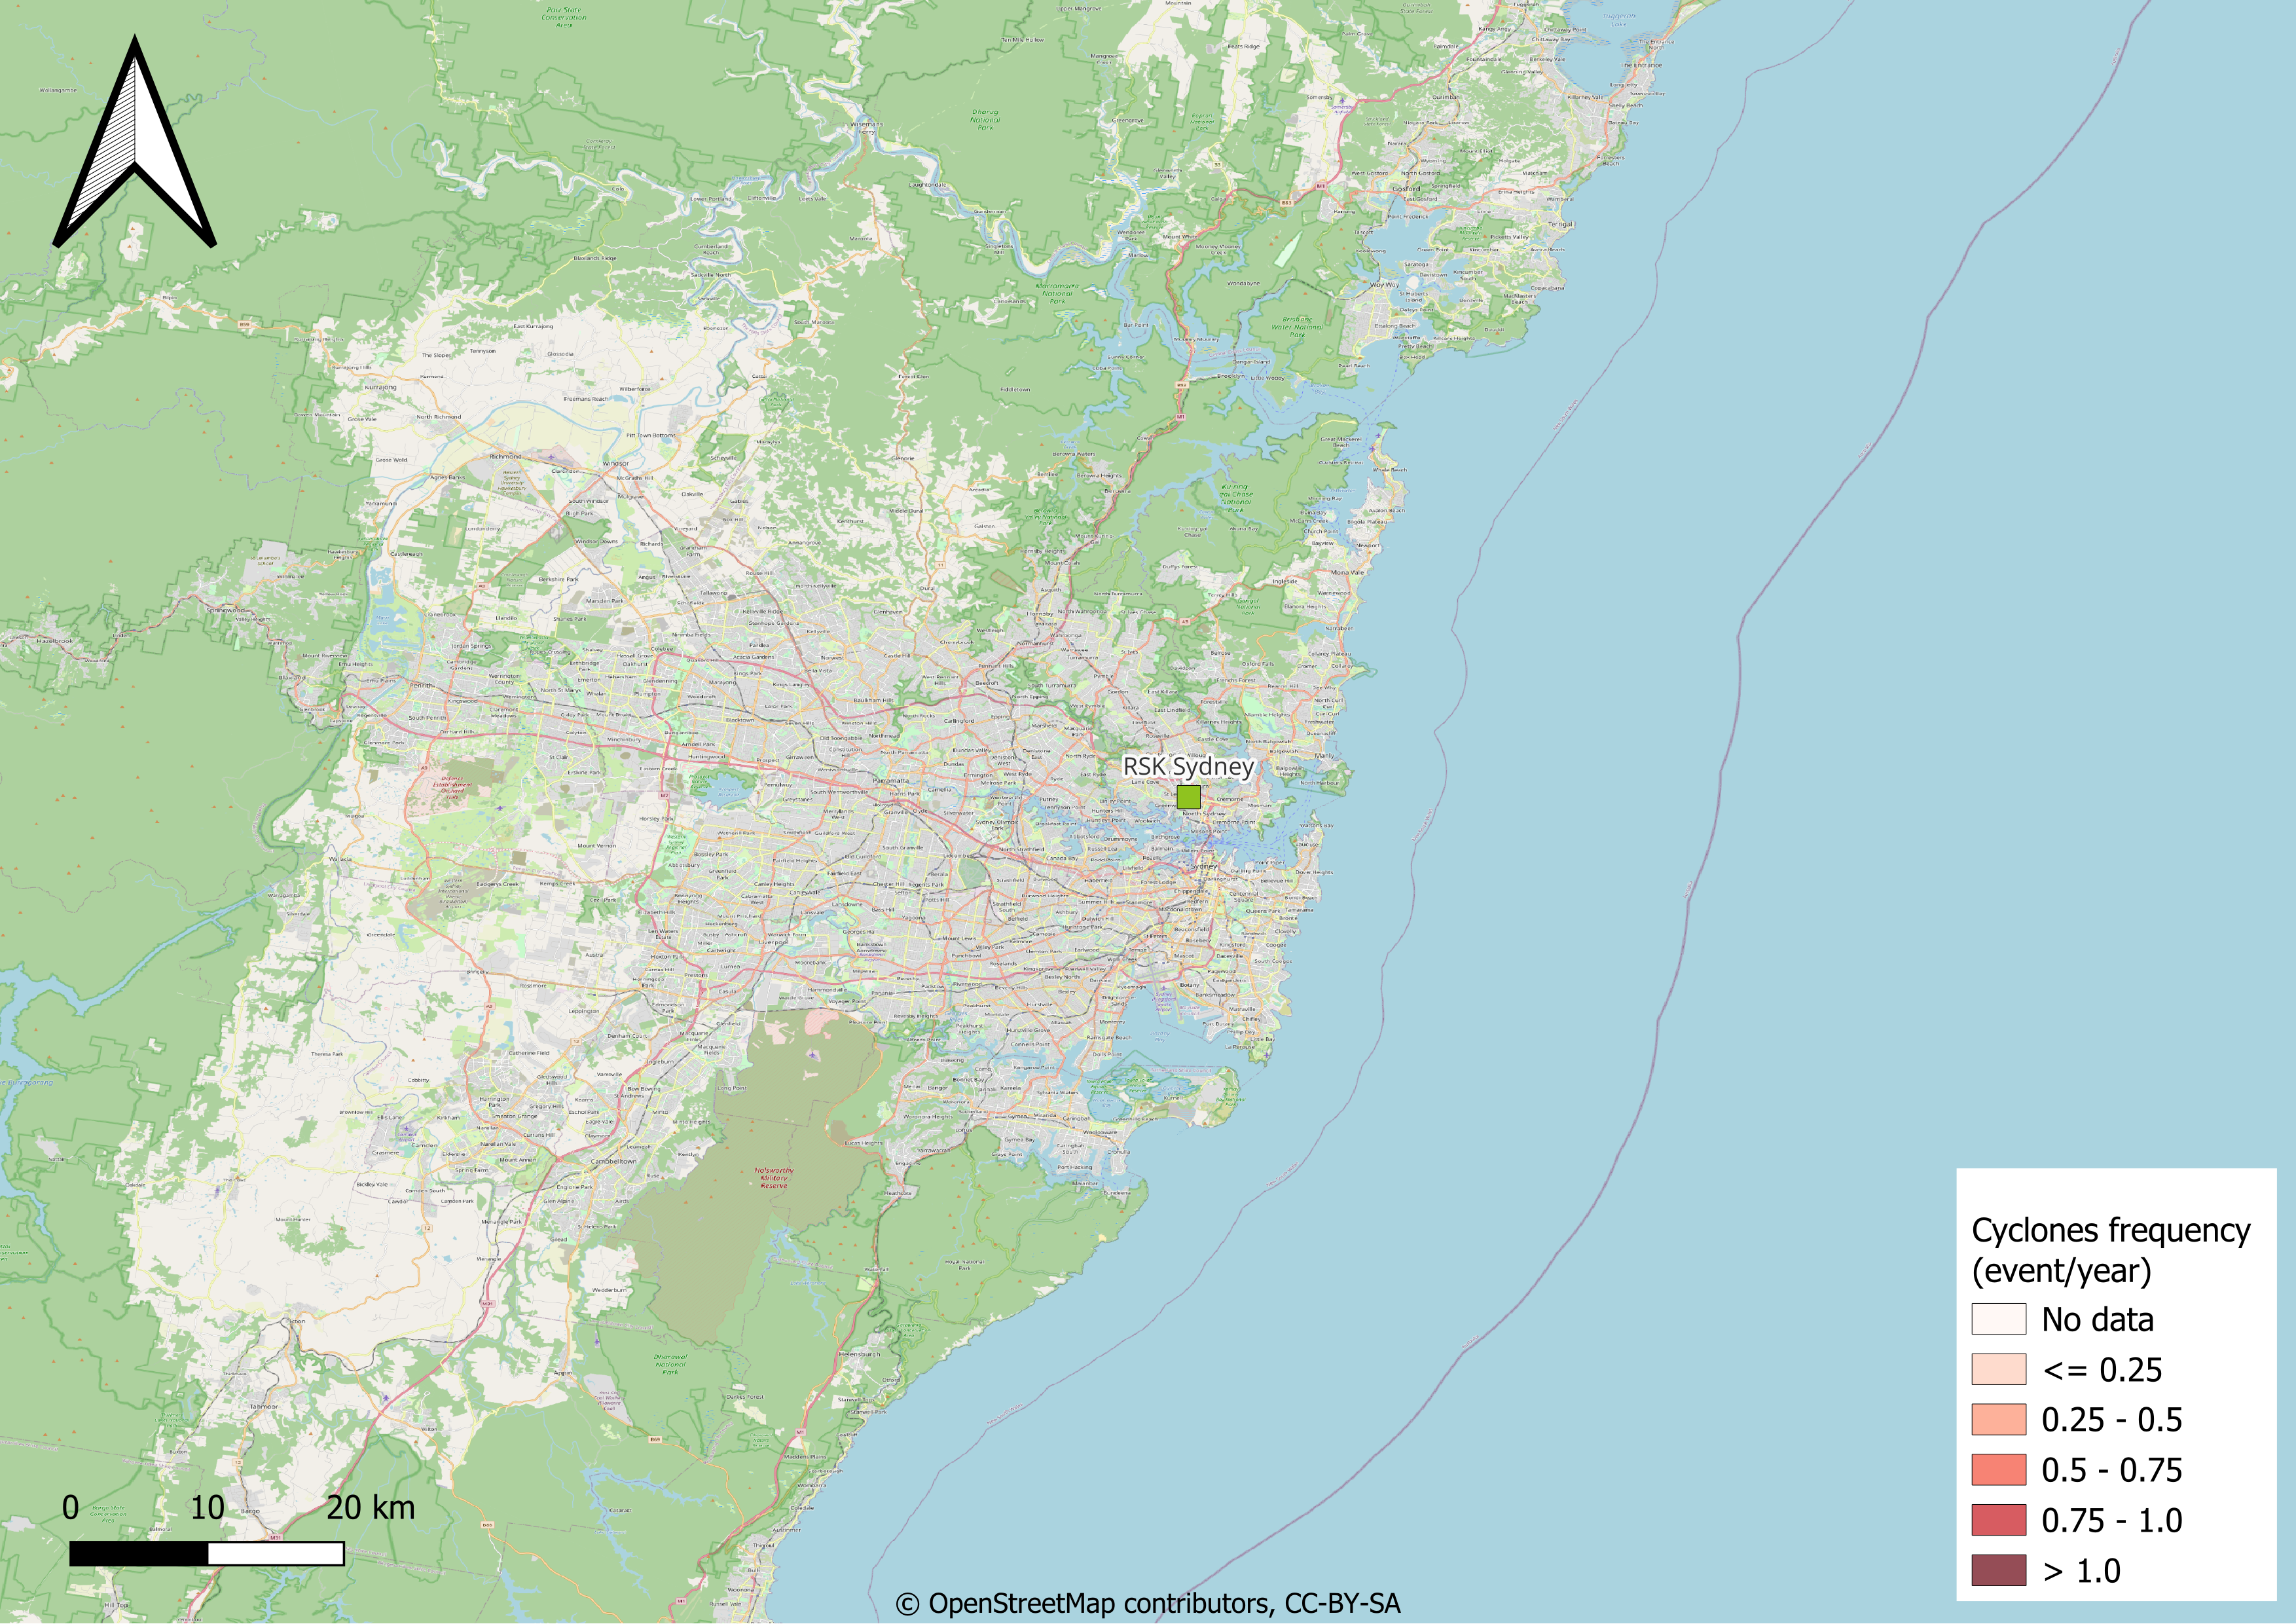
Tropical cyclones frequency in events per year is an estimate of the tropical cyclone frequency of Saffir-Simpson category 5. Source: IBTrACS processed by UNEP/GRID-Geneva.
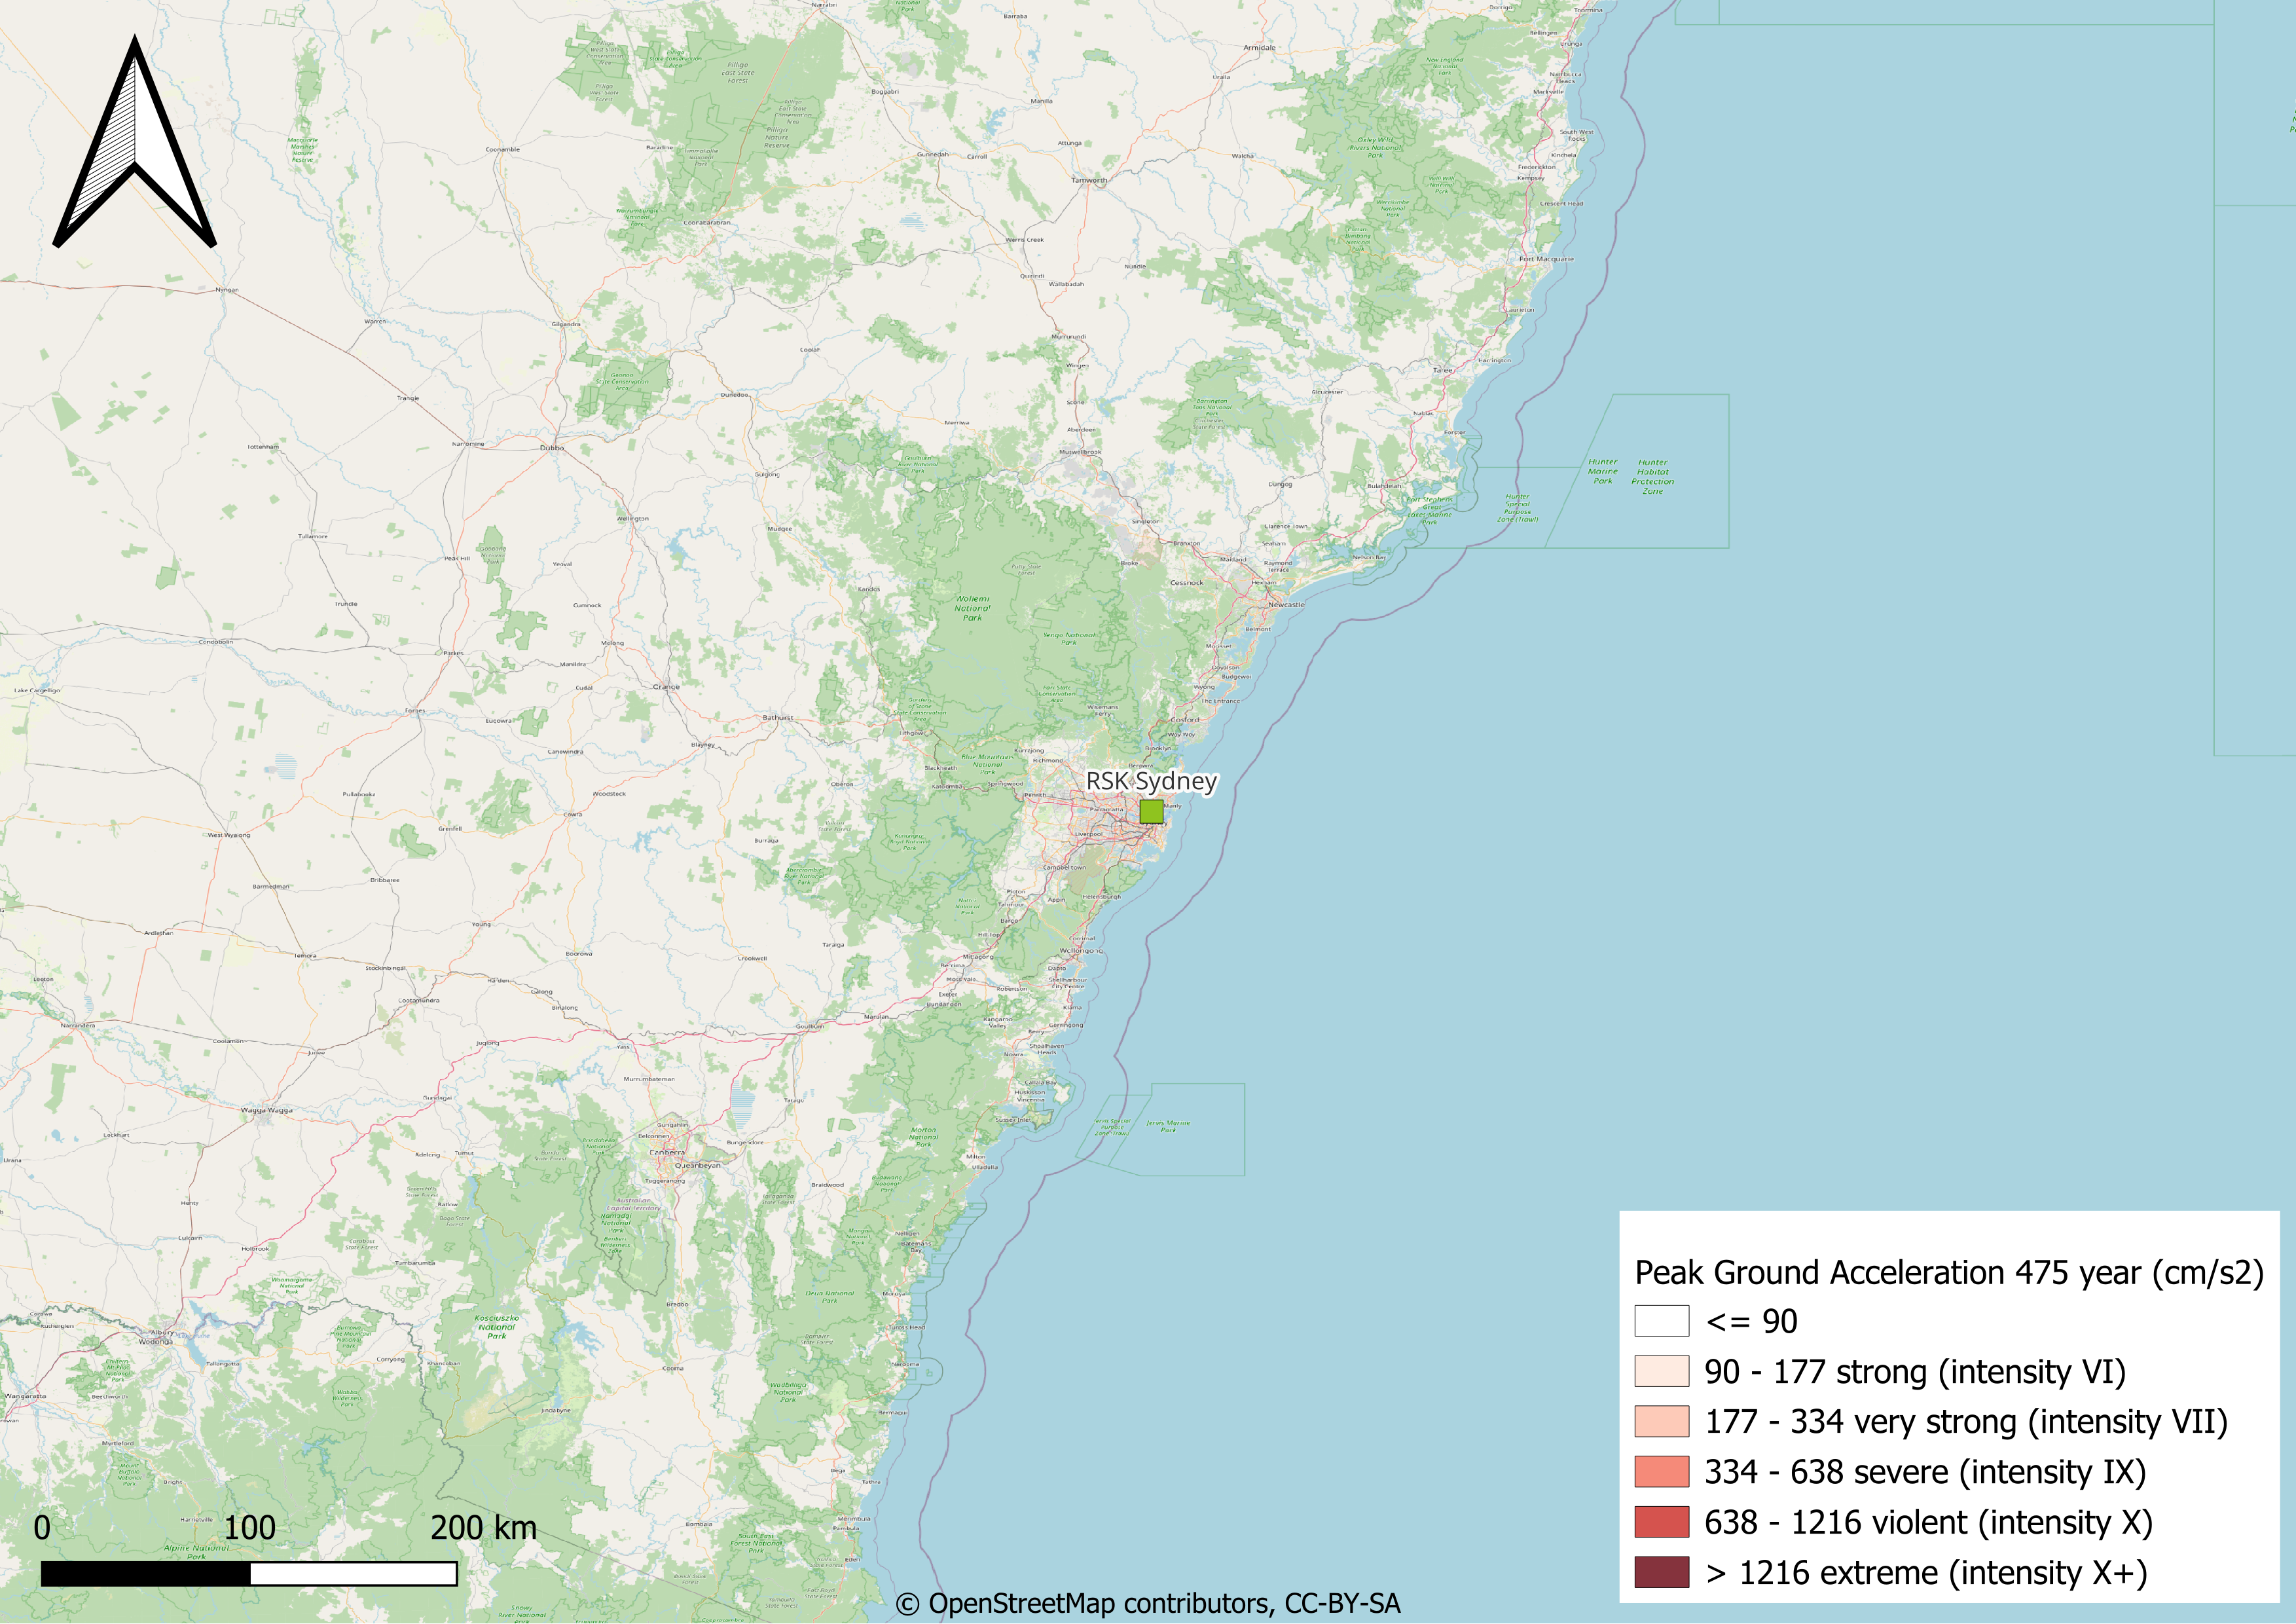
Estimated Peak Ground Acceleration (PGA) (cm/s2) in a 475 years retorn period earthquake in Sidney.
Projected Hazards
The baseline and projected future averaged value of each CID analyzed for this site is presented in the following table. The future projected values for years 2030 and 2050 are displayed for scenario RCP2.6 (green path) and RCP8.5 (unrestricted growth). The temporal evolution of the CID and the mean value for each time period are displayed by clicking on the CID name. Each climate-related hazard is evaluated in a specific section.
Climate Impact-Driver (chart link) |
Units |
Historical |
2030 | 2.6 |
2030 | 8.5 |
2050 | 2.6 |
2050 | 8.5 |
Source |
|---|---|---|---|---|---|---|---|
[-] |
1.6 |
1.6 |
1.6 |
1.7 |
1.5 |
||
days |
34.3 |
31.7 |
33.3 |
29.3 |
31.8 |
||
days |
7.2 |
7.3 |
7.6 |
7.6 |
7.9 |
||
°C |
20.9 |
22.3 |
22.4 |
23.0 |
23.7 |
||
°C |
20.1 |
21.5 |
21.6 |
22.2 |
22.9 |
||
°C |
14.2 |
15.8 |
15.9 |
16.4 |
17.3 |
||
°C |
13.4 |
14.9 |
15.1 |
15.6 |
16.5 |
||
°C |
6.7 |
6.5 |
6.5 |
6.6 |
6.4 |
||
mm yr-1 |
947.4 |
1075.9 |
1066.2 |
1068.0 |
1124.4 |
||
days |
0.0 |
0.0 |
0.0 |
0.0 |
0.0 |
||
days |
360.0 |
360.0 |
360.0 |
360.0 |
360.0 |
||
days |
15.6 |
17.5 |
17.1 |
16.6 |
19.2 |
||
days |
0.0 |
0.0 |
0.0 |
0.0 |
0.0 |
||
mm |
61.7 |
84.4 |
66.9 |
70.5 |
72.8 |
||
mm |
102.6 |
134.7 |
120.7 |
118.8 |
127.5 |
||
°C |
36.2 |
37.6 |
37.9 |
38.6 |
39.0 |
||
°C |
25.7 |
26.9 |
27.2 |
27.6 |
28.3 |
||
°C |
11.3 |
12.5 |
12.7 |
13.0 |
14.1 |
||
°C |
5.6 |
7.2 |
7.6 |
7.9 |
9.0 |
||
°C |
17.4 |
18.8 |
19.0 |
19.4 |
20.3 |
||
°C |
17.8 |
19.2 |
19.4 |
19.9 |
20.7 |
||
m s-1 |
4.0 |
4.0 |
4.0 |
4.0 |
3.9 |
||
days |
78.6 |
86.7 |
88.0 |
87.0 |
92.4 |
||
mm yr-1 |
635.0 |
725.7 |
705.5 |
683.9 |
770.5 |
||
mm yr-1 |
1287.0 |
1470.9 |
1429.9 |
1386.1 |
1561.6 |
||
mm d-1 |
7.4 |
7.7 |
7.4 |
7.2 |
7.9 |
||
days |
80.6 |
108.3 |
110.9 |
122.1 |
139.2 |
||
mm |
588.4 |
677.2 |
657.9 |
633.4 |
722.1 |
||
mm |
1192.6 |
1372.6 |
1333.5 |
1283.8 |
1463.5 |
||
days |
27.4 |
66.6 |
67.1 |
83.5 |
111.6 |
||
days |
6.5 |
7.3 |
7.0 |
6.8 |
7.8 |
CIDs with the (bc) suffix correspond to the biased corrected variables. The bias factors and corrections applied are described in the next table.
Climate Impact-Driver |
Modelled |
Observed |
Deviation |
Factor |
Delta |
|---|---|---|---|---|---|
Daily maximum near surface air temperature |
20.91 |
20.10 |
4.02 % |
-0.81 °C |
|
Daily minimum near surface air temperature |
14.25 |
13.40 |
6.31 % |
-0.85 °C |
|
Near surface air temperature |
17.36 |
17.80 |
-2.46 % |
0.44 °C |
|
Precipitation |
634.97 |
1287.00 |
-50.66 % |
2.03 [-] |
Mean temperature
By 2030, temperatures in Sydney are projected to increase by 8-9%, while by 2050 they might increase up to 16%.
Climate Impact-Driver (chart link) |
Historical |
2030 | 2.6 change |
2030 | 8.5 change |
2050 | 2.6 change |
2050 | 8.5 change |
Source |
|---|---|---|---|---|---|---|
17.8 °C |
Increase |
Increase |
Large Increase |
Large Increase |
Extreme Heat
CIDs associated with extreme heat events are projected to increase largely for both time periods and scenarios except for the daily maximum air temperature in RCP2.6 and RCP8.5 by 2030, which is expected to increase. Considering the current frequency of heatwaves and the increase in tropical nights and summer days, it is projected that extreme heat events hazards in Sydney will be more frequent in the future. By 2050, in the best-case scenarios, maximum average temperatures will increase from 20.1 ºC to 21.6 ºC, while in the worst-case average temperatures might reach almost 23 ºC. By 2050, the number of summer days (when maximum temperatures exceeds 35 ºC) are expected to increase from 80 to 140 days per year. As for tropical nights (when minimum temperature exceeds 20 ºC), by 2050 they might increase from 30 to more than 110 per year.
Climate Impact-Driver (chart link) |
Historical |
2030 | 2.6 - impact on hazard |
2030 | 8.5 - impact on hazard |
2050 | 2.6 - impact on hazard |
2050 | 8.5 - impact on hazard |
Source |
|---|---|---|---|---|---|---|
20.1 °C |
Increase |
Increase |
Large Increase |
Large Increase |
||
80.6 days |
Large Increase |
Large Increase |
Large Increase |
Large Increase |
||
27.4 days |
Large Increase |
Large Increase |
Large Increase |
Large Increase |
Cold spells and frosts
No frost or ice days have been recorded in the last decades in Sydney. Therefore, this hazard can be considered as “non-relevant” for this RSK office.
Climate Impact-Driver (chart link) |
Historical |
2030 | 2.6 - impact on hazard |
2030 | 8.5 - impact on hazard |
2050 | 2.6 - impact on hazard |
2050 | 8.5 - impact on hazard |
Source |
|---|---|---|---|---|---|---|
0.0 days |
No Change |
No Change |
No Change |
No Change |
||
0.0 days |
No Change |
No Change |
No Change |
No Change |
Mean precipitation
The mean precipitations in Sydney are expected to increase significantly. In the medium-term, they are projected to increase by between the 11% and the 14%, while in the long-term the increase depends heavily on the scenario analysed. In fact, under the RCP2.6 scenario the expected precipitation increase is about 8%, while in the worst-case scenario an increase by 21% is projected.
Climate Impact-Driver (chart link) |
Historical |
2030 | 2.6 change |
2030 | 8.5 change |
2050 | 2.6 change |
2050 | 8.5 change |
Source |
|---|---|---|---|---|---|---|
1287.0 mm yr-1 |
Large Increase |
Large Increase |
Increase |
Large Increase |
Floods and landslides
The future projections for floods and landslides in Sydney reflect the significant increase in mean precipitations for the area. As it can be observed, not only average precipitations are expected to increase, but also a rise in strong precipitations is projected. Heavy and very heavy precipitations days’ projections show a wide variation, depending on the scenario and timeframe analysed. The projected increase in these climate impact drivers span between 3.3% and 22%. As for maximum 1-day and maximum 5-days precipitations, projections show a rise between 8% and almost 37%. This significant increase in strong precipitations is expected to increase the floods and landslides hazards, therefore potentially affecting vulnerable locations and infrastructure in the city of Sydney.
Climate Impact-Driver (chart link) |
Historical |
2030 | 2.6 - impact on hazard |
2030 | 8.5 - impact on hazard |
2050 | 2.6 - impact on hazard |
2050 | 8.5 - impact on hazard |
Source |
|---|---|---|---|---|---|---|
15.6 days |
Large Increase |
Increase |
Increase |
Large Increase |
||
61.7 mm |
Large Increase |
Increase |
Large Increase |
Large Increase |
||
102.6 mm |
Large Increase |
Large Increase |
Large Increase |
Large Increase |
||
6.5 days |
Large Increase |
Increase |
No Change |
Large Increase |
Aridity
Driven by the increase in average precipitations, the aridity hazard is expected to decrease in Sydney. On the one side, the aridity index (ratio between the precipitation and the evaporation) is not projected to vary signficantly. On the other, under all scenario and for all timeframes the number of consecutive dry days is projected to decrease.
Climate Impact-Driver (chart link) |
Historical |
2030 | 2.6 - impact on hazard |
2030 | 8.5 - impact on hazard |
2050 | 2.6 - impact on hazard |
2050 | 8.5 - impact on hazard |
Source |
|---|---|---|---|---|---|---|
1.6 [-] |
No Change |
No Change |
No Change |
No Change |
||
34.3 days |
Decrease |
No Change |
Large Decrease |
Decrease |
Drought
Similarly to aridity, the drought hazard for Sydney is expected to decrease, driven by a decrease in the number of consecutive dry days and a rise in the total number of wet days.
Climate Impact-Driver (chart link) |
Historical |
2030 | 2.6 - impact on hazard |
2030 | 8.5 - impact on hazard |
2050 | 2.6 - impact on hazard |
2050 | 8.5 - impact on hazard |
Source |
|---|---|---|---|---|---|---|
34.3 days |
Decrease |
No Change |
Large Decrease |
Decrease |
||
78.6 days |
Large Decrease |
Large Decrease |
Large Decrease |
Large Decrease |
Wildfire
As a consequence of the increase in average precipitations, the wildfire hazard is expected to be less significant in the future.
Climate Impact-Driver (chart link) |
Historical |
2030 | 2.6 - impact on hazard |
2030 | 8.5 - impact on hazard |
2050 | 2.6 - impact on hazard |
2050 | 8.5 - impact on hazard |
Source |
|---|---|---|---|---|---|---|
34.3 days |
Decrease |
No Change |
Large Decrease |
Decrease |
||
4.0 m s-1 |
No Change |
No Change |
No Change |
No Change |
||
78.6 days |
Large Decrease |
Large Decrease |
Large Decrease |
Large Decrease |
Coastal flood
Given that the RSK office in Sydney is located at an elevation of 90 m above the sea level, no direct hazard linked to coastal floods is expected. Nonetheless, other areas of the city, as well as potentially critical infrastructure, might be affected by this hazard and cause delays or economic losses.
CID |
2030 | 2.6 |
2030 | 8.5 |
2050 | 2.6 |
2050 | 8.5 |
|---|---|---|---|---|
Relative sea level rise |
0.09 |
0.18 |
0.1 |
0.23 |
Conclusions
This section summarizes the climate-related physical hazards affecting Amphos 21 office in Barcelona. The projected future evolution of the hazards is graded between a large decrease to a large increase in the hazard. Some of the hazards are non relevant for a site. In the case of RSK Sydney, cold spells and frosts hazards can be disregarded.
The average increase in temperatures is expected to lead to a large increase in the extreme hot hazard. The increase in average precipitations is expected on the one side to decrease the occurence of droughts, aridity and wildfires, while on the other is expected to lead to a large increase in floods and landslides. The sea level is projected to rise and, even if not directly affecting the RSK office, it could lead to consequences to other key assets and infrastructures in the metropolitan area of Sydney.
Hazard |
2030 | 2.6 - Estimated Physical Risk Change |
2030 | 8.5 - Estimated Physical Risk Change |
2050 | 2.6 - Estimated Physical Risk Change |
2050 | 8.5 - Estimated Physical Risk Change |
|---|---|---|---|---|
Extreme heat |
Large Increase |
Large Increase |
Large Increase |
Large Increase |
Cold spell and frost |
No Relevant |
No Relevant |
No Relevant |
No Relevant |
Floods |
Large Increase |
Increase |
Large Increase |
Large Increase |
Landslide |
Large Increase |
Increase |
Large Increase |
Large Increase |
Aridity |
Decrease |
No Change |
Decrease |
Decrease |
Drought |
Large Decrease |
Decrease |
Large Decrease |
Large Decrease |
Wildfire |
Decrease |
Decrease |
Decrease |
Decrease |
Coastal flood |
No Change |
Increase |
Increase |
Increase |
Wind |
No Change |
No Change |
No Change |
No Change |