RSK Dar es Salaam
Background
Dar es Salaam is located on a natural harbour on the coast of East Africa, facing the Indian Ocean. The city has a lowland coastal orientation and the presence of the seasonal Msimbazi River. The RSK office in Dar es Salaam is in the Msasani peninsula and it’s located at an altitude of17 m above the sea level.

Location of the RSK office in Dar es Salaam.
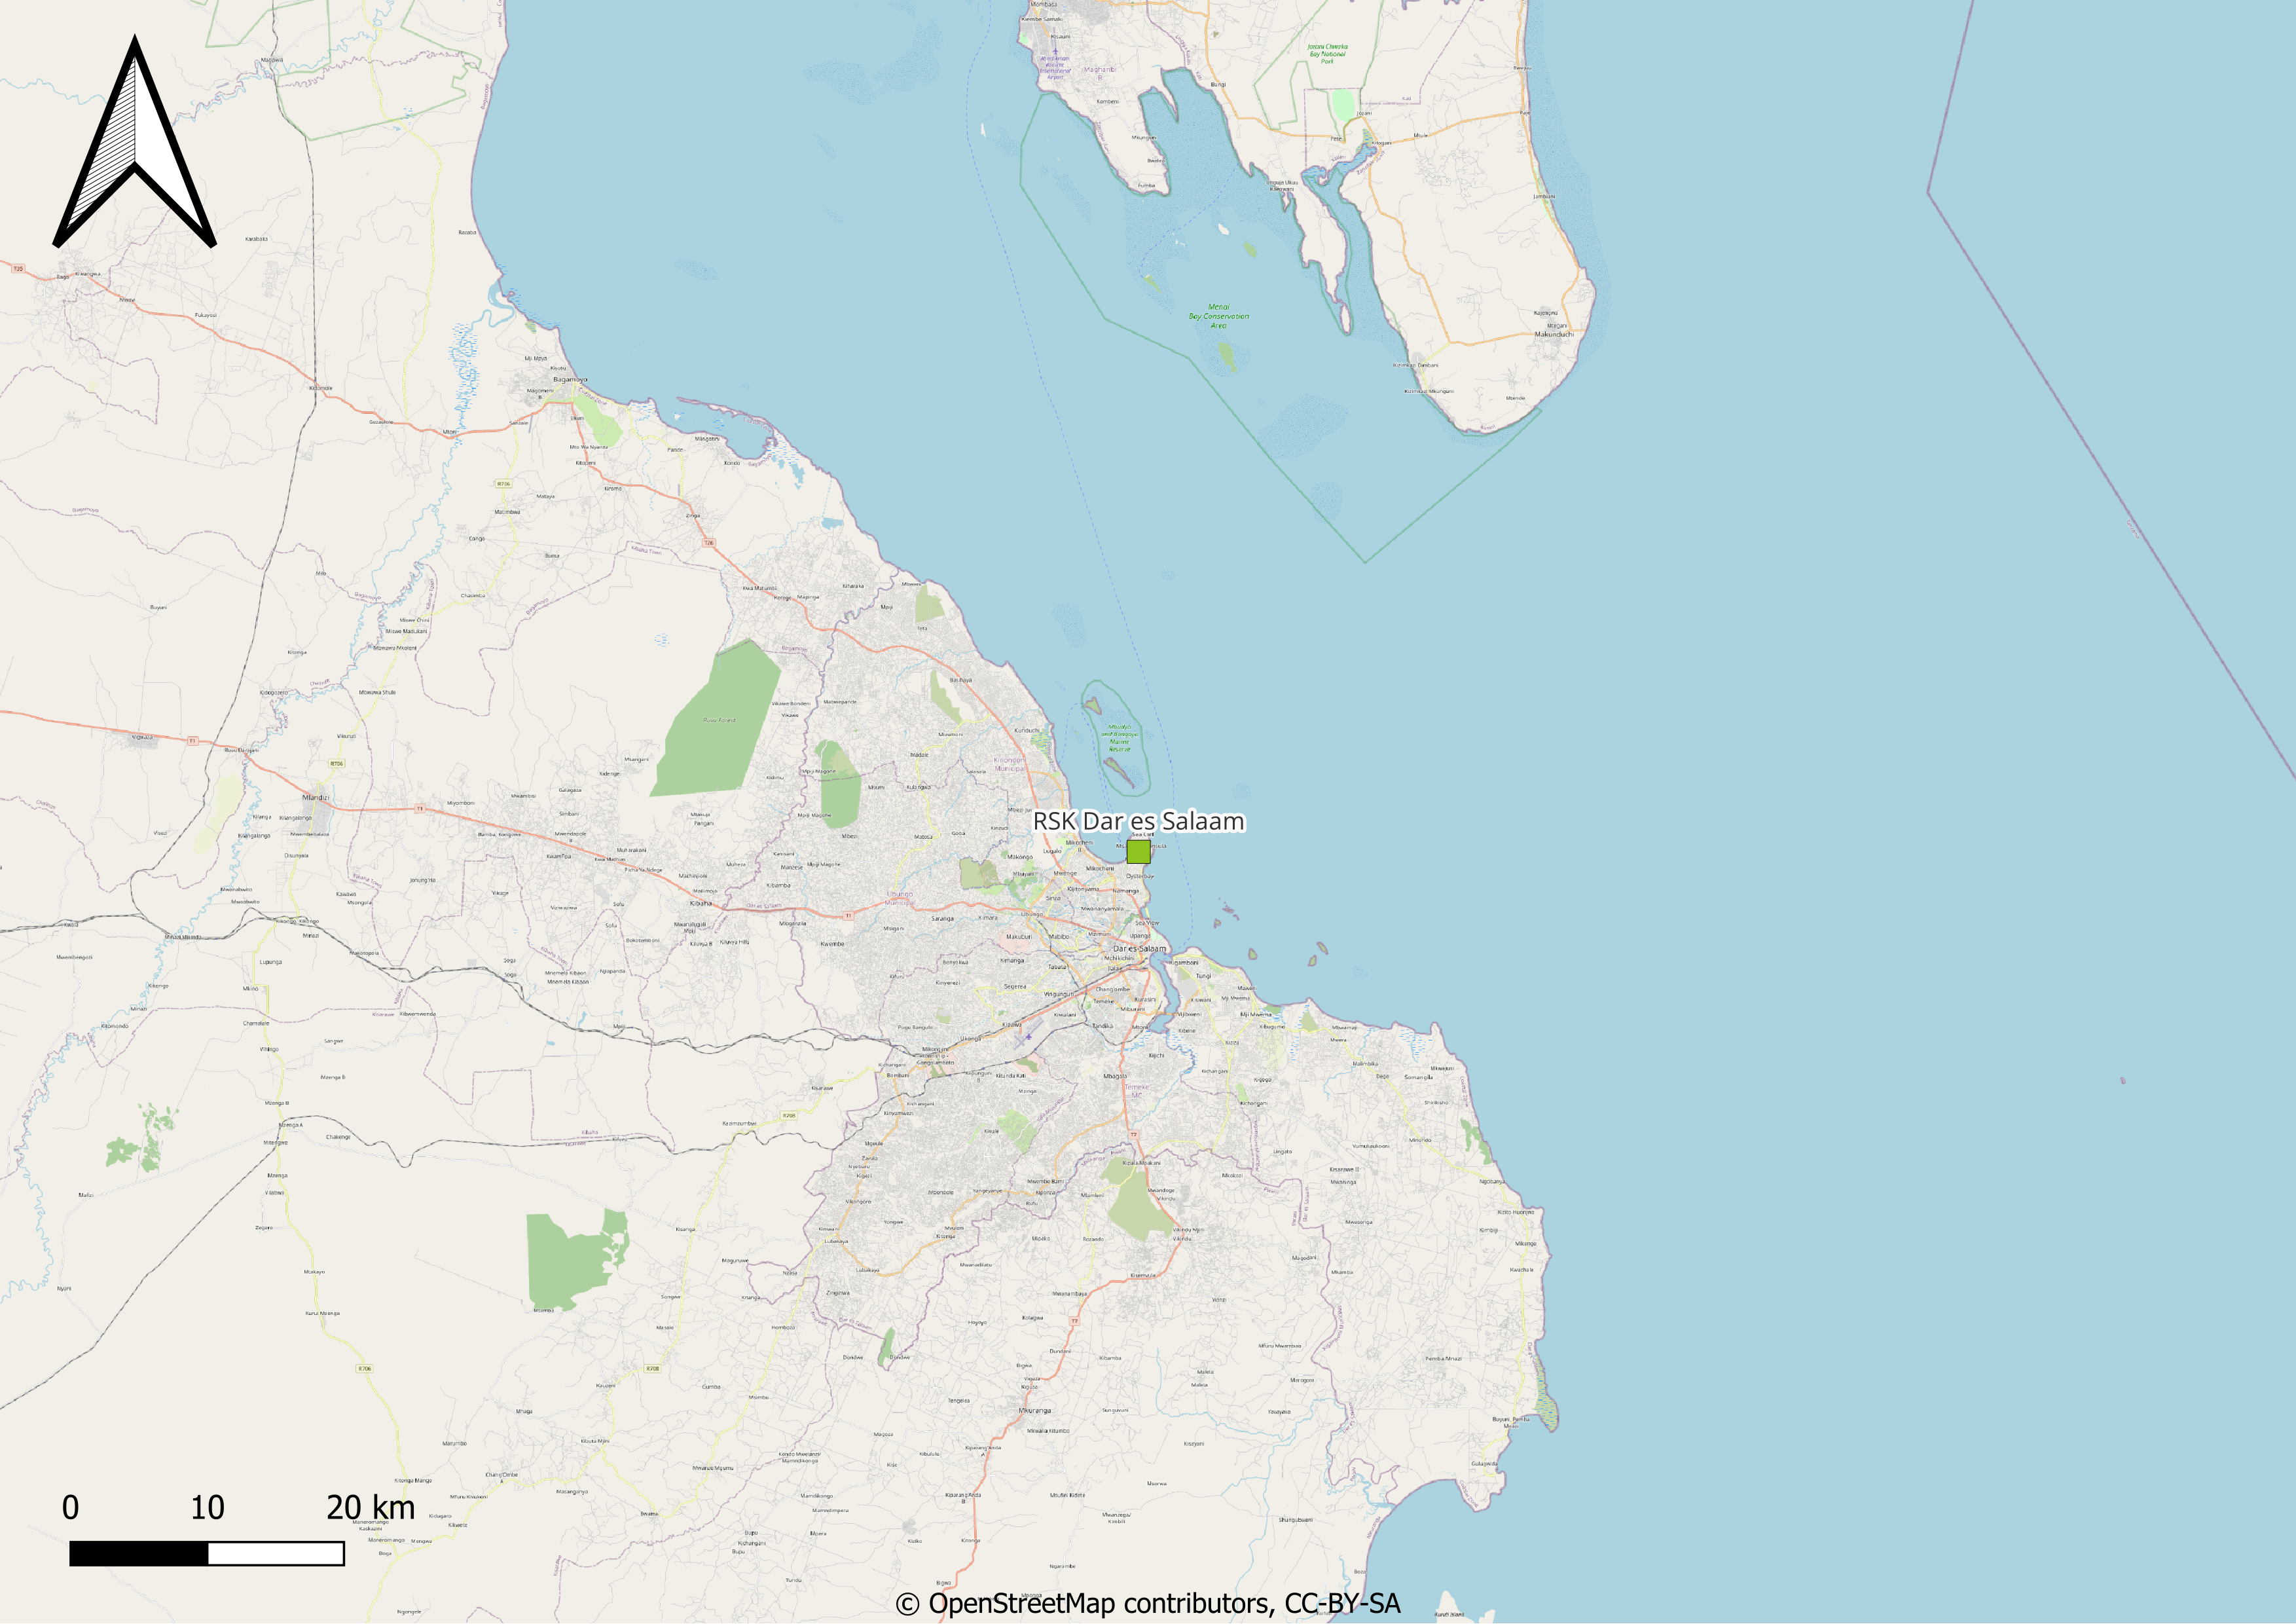
Detailed location of the RSK office in Dar es Salaam.
Natural risk past events
No climate-related past events or special adaptation measures have been reported from the Dar es Salaam facility.
Current Baseline
The climate of Dar es Salaam is Tropical savanna (Aw) with limited temperature variations along the year. Precipitantions fall mainly in two rainy seasons, during the spring and the late autumn. Overall yearly precipitations exceed 1000 mm.
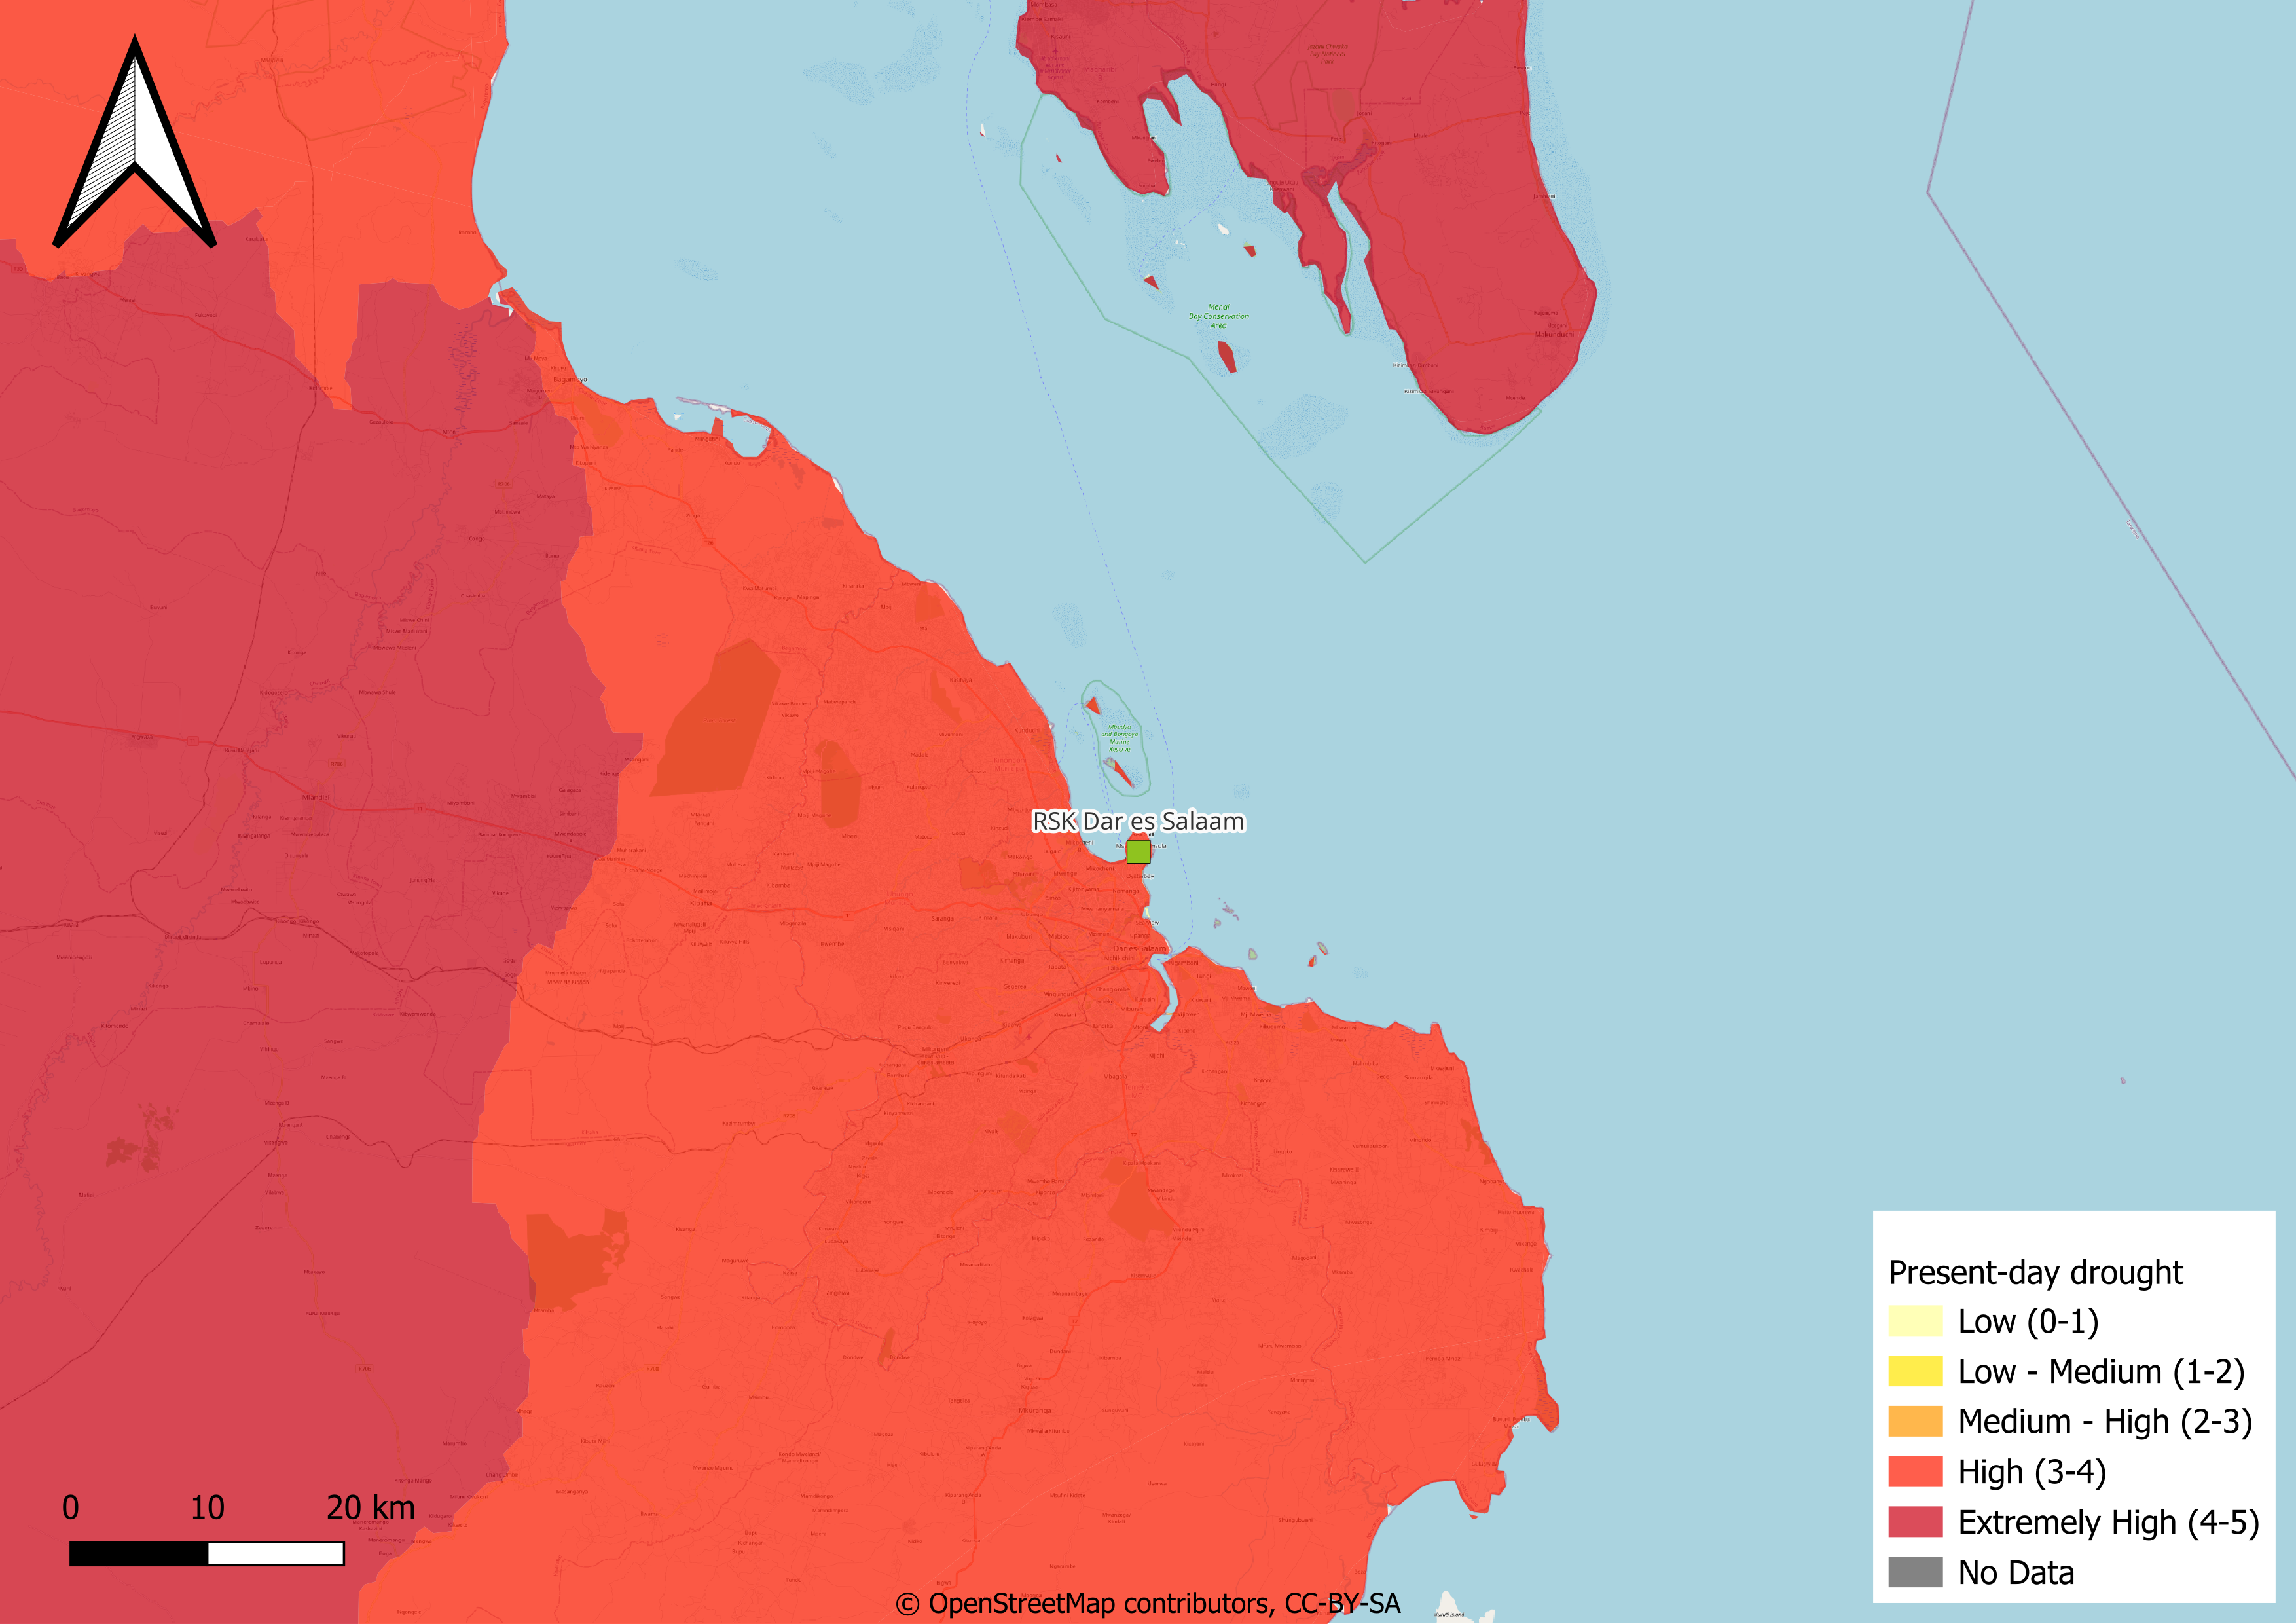
The current water stress of the Dar es Salaam region is low, while the drought risk is high. Some parts of Dar es Salaam, and in particular those close to the Msimbazi River, are exposed to floods and have already been affected in the past decades. As for landslides, the city of Dar es Salaam is not affected by this hazards, with the exception of the surrounding natural areas to the West and the South. The city of Sydney, like the rest of the country, is exposed to low to medium earthquake hazard.
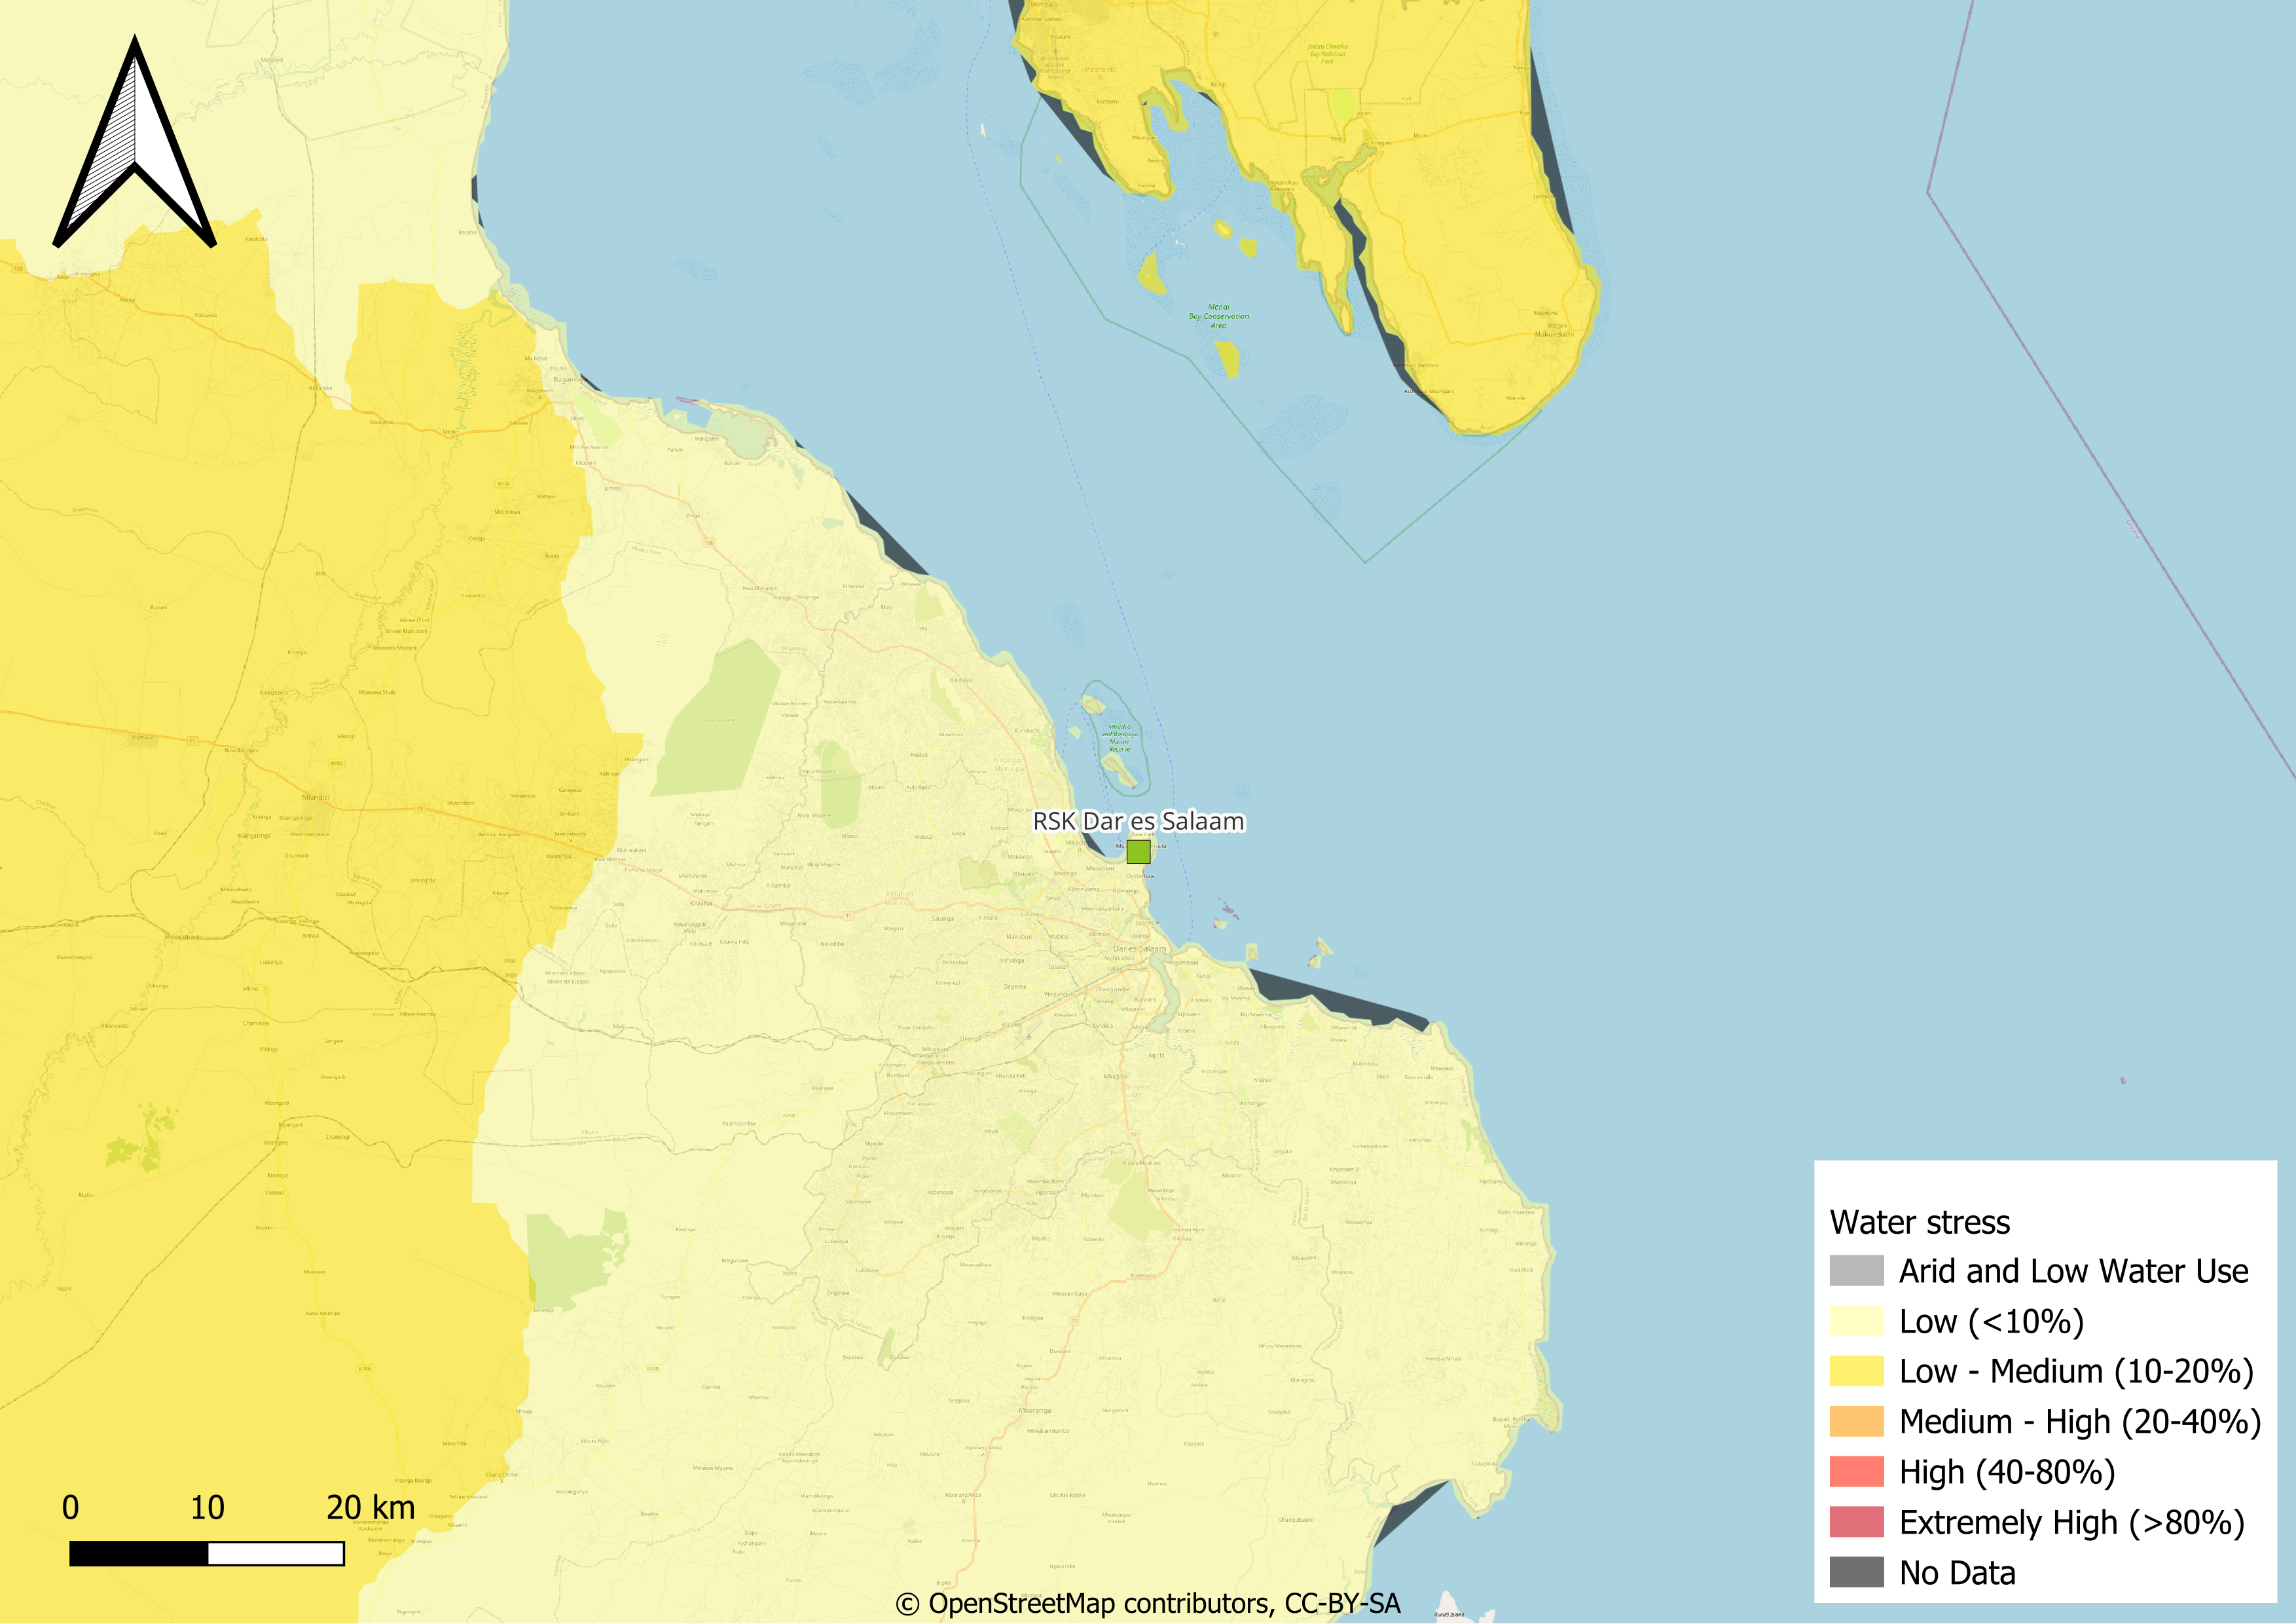
Present-day water stress in Dar es Salaam. Source: Aqueduct.
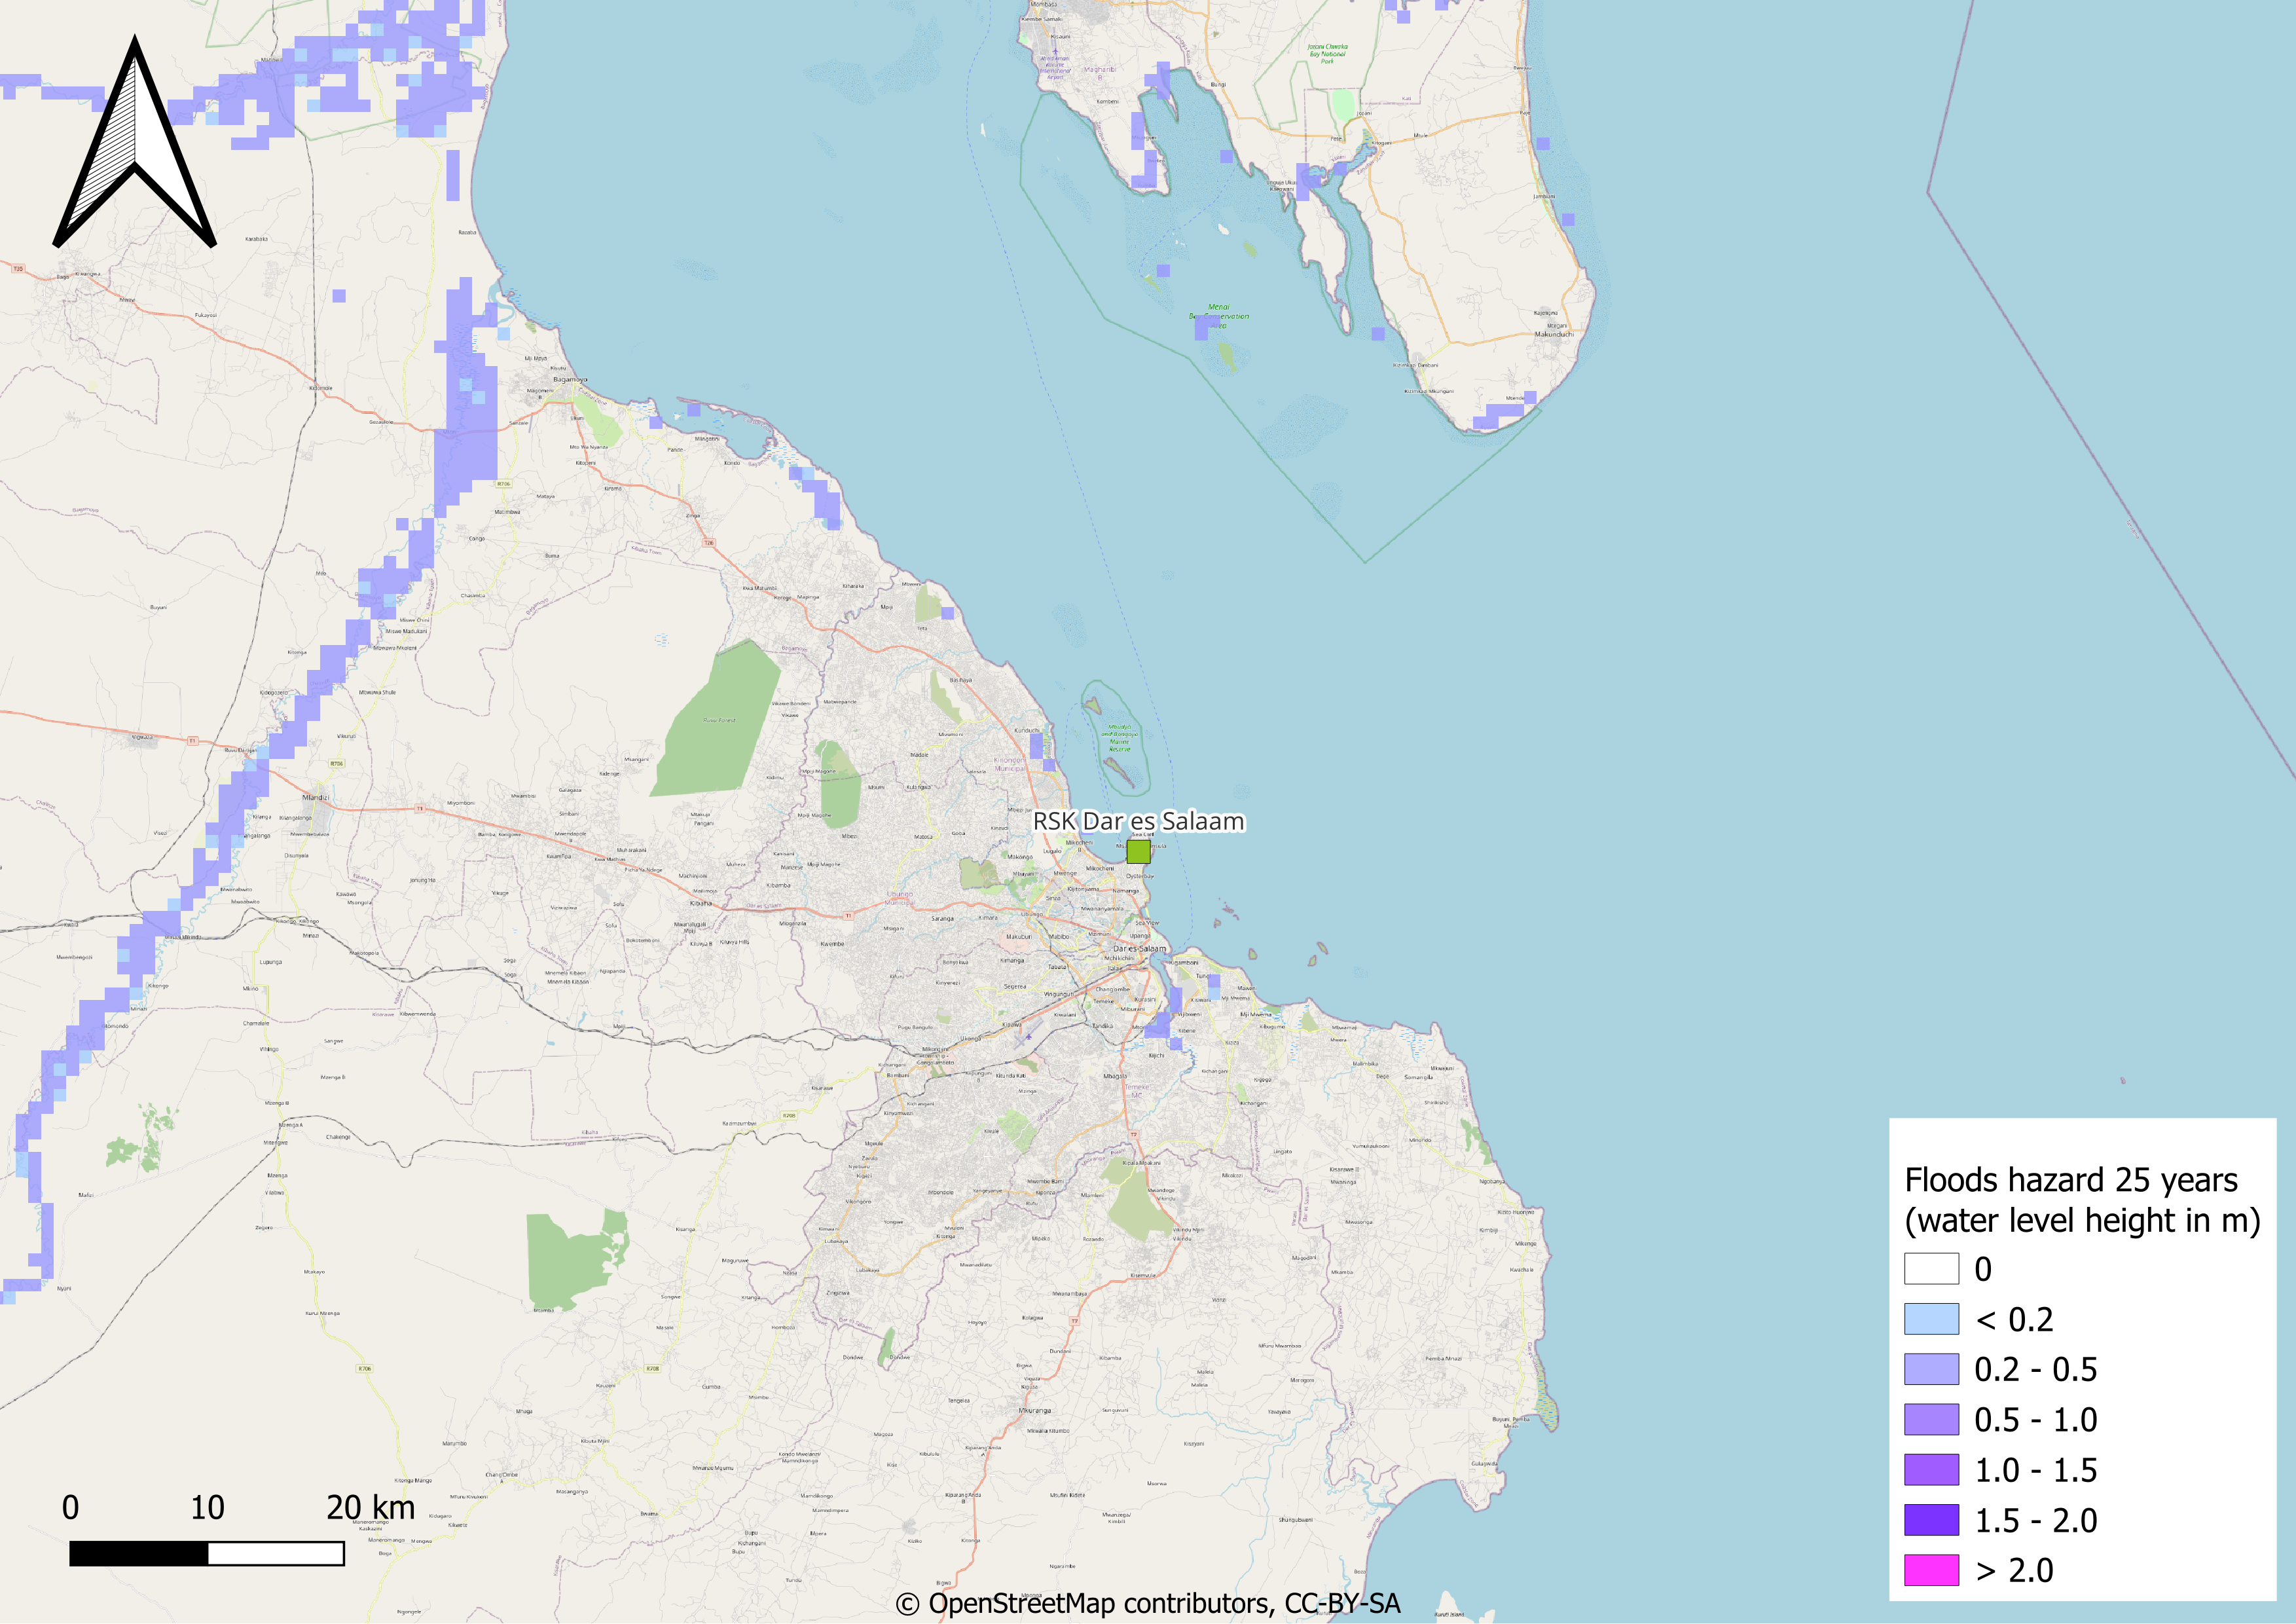
Present-day flood hazard in a 25 years return period in Dar es Salaam. The values are expected water level high in meters. The return period indicates that the flood of this magnitude is expected once every 25 years. Source: WRI - Aqueduct Floods.

Present-day flood hazard in a 100 years return period in Dar es Salaam. The values are expected water level high in meters. The return period indicates that the flood of this magnitude is expected once every 100 years. Source: WRI - Aqueduct Floods.
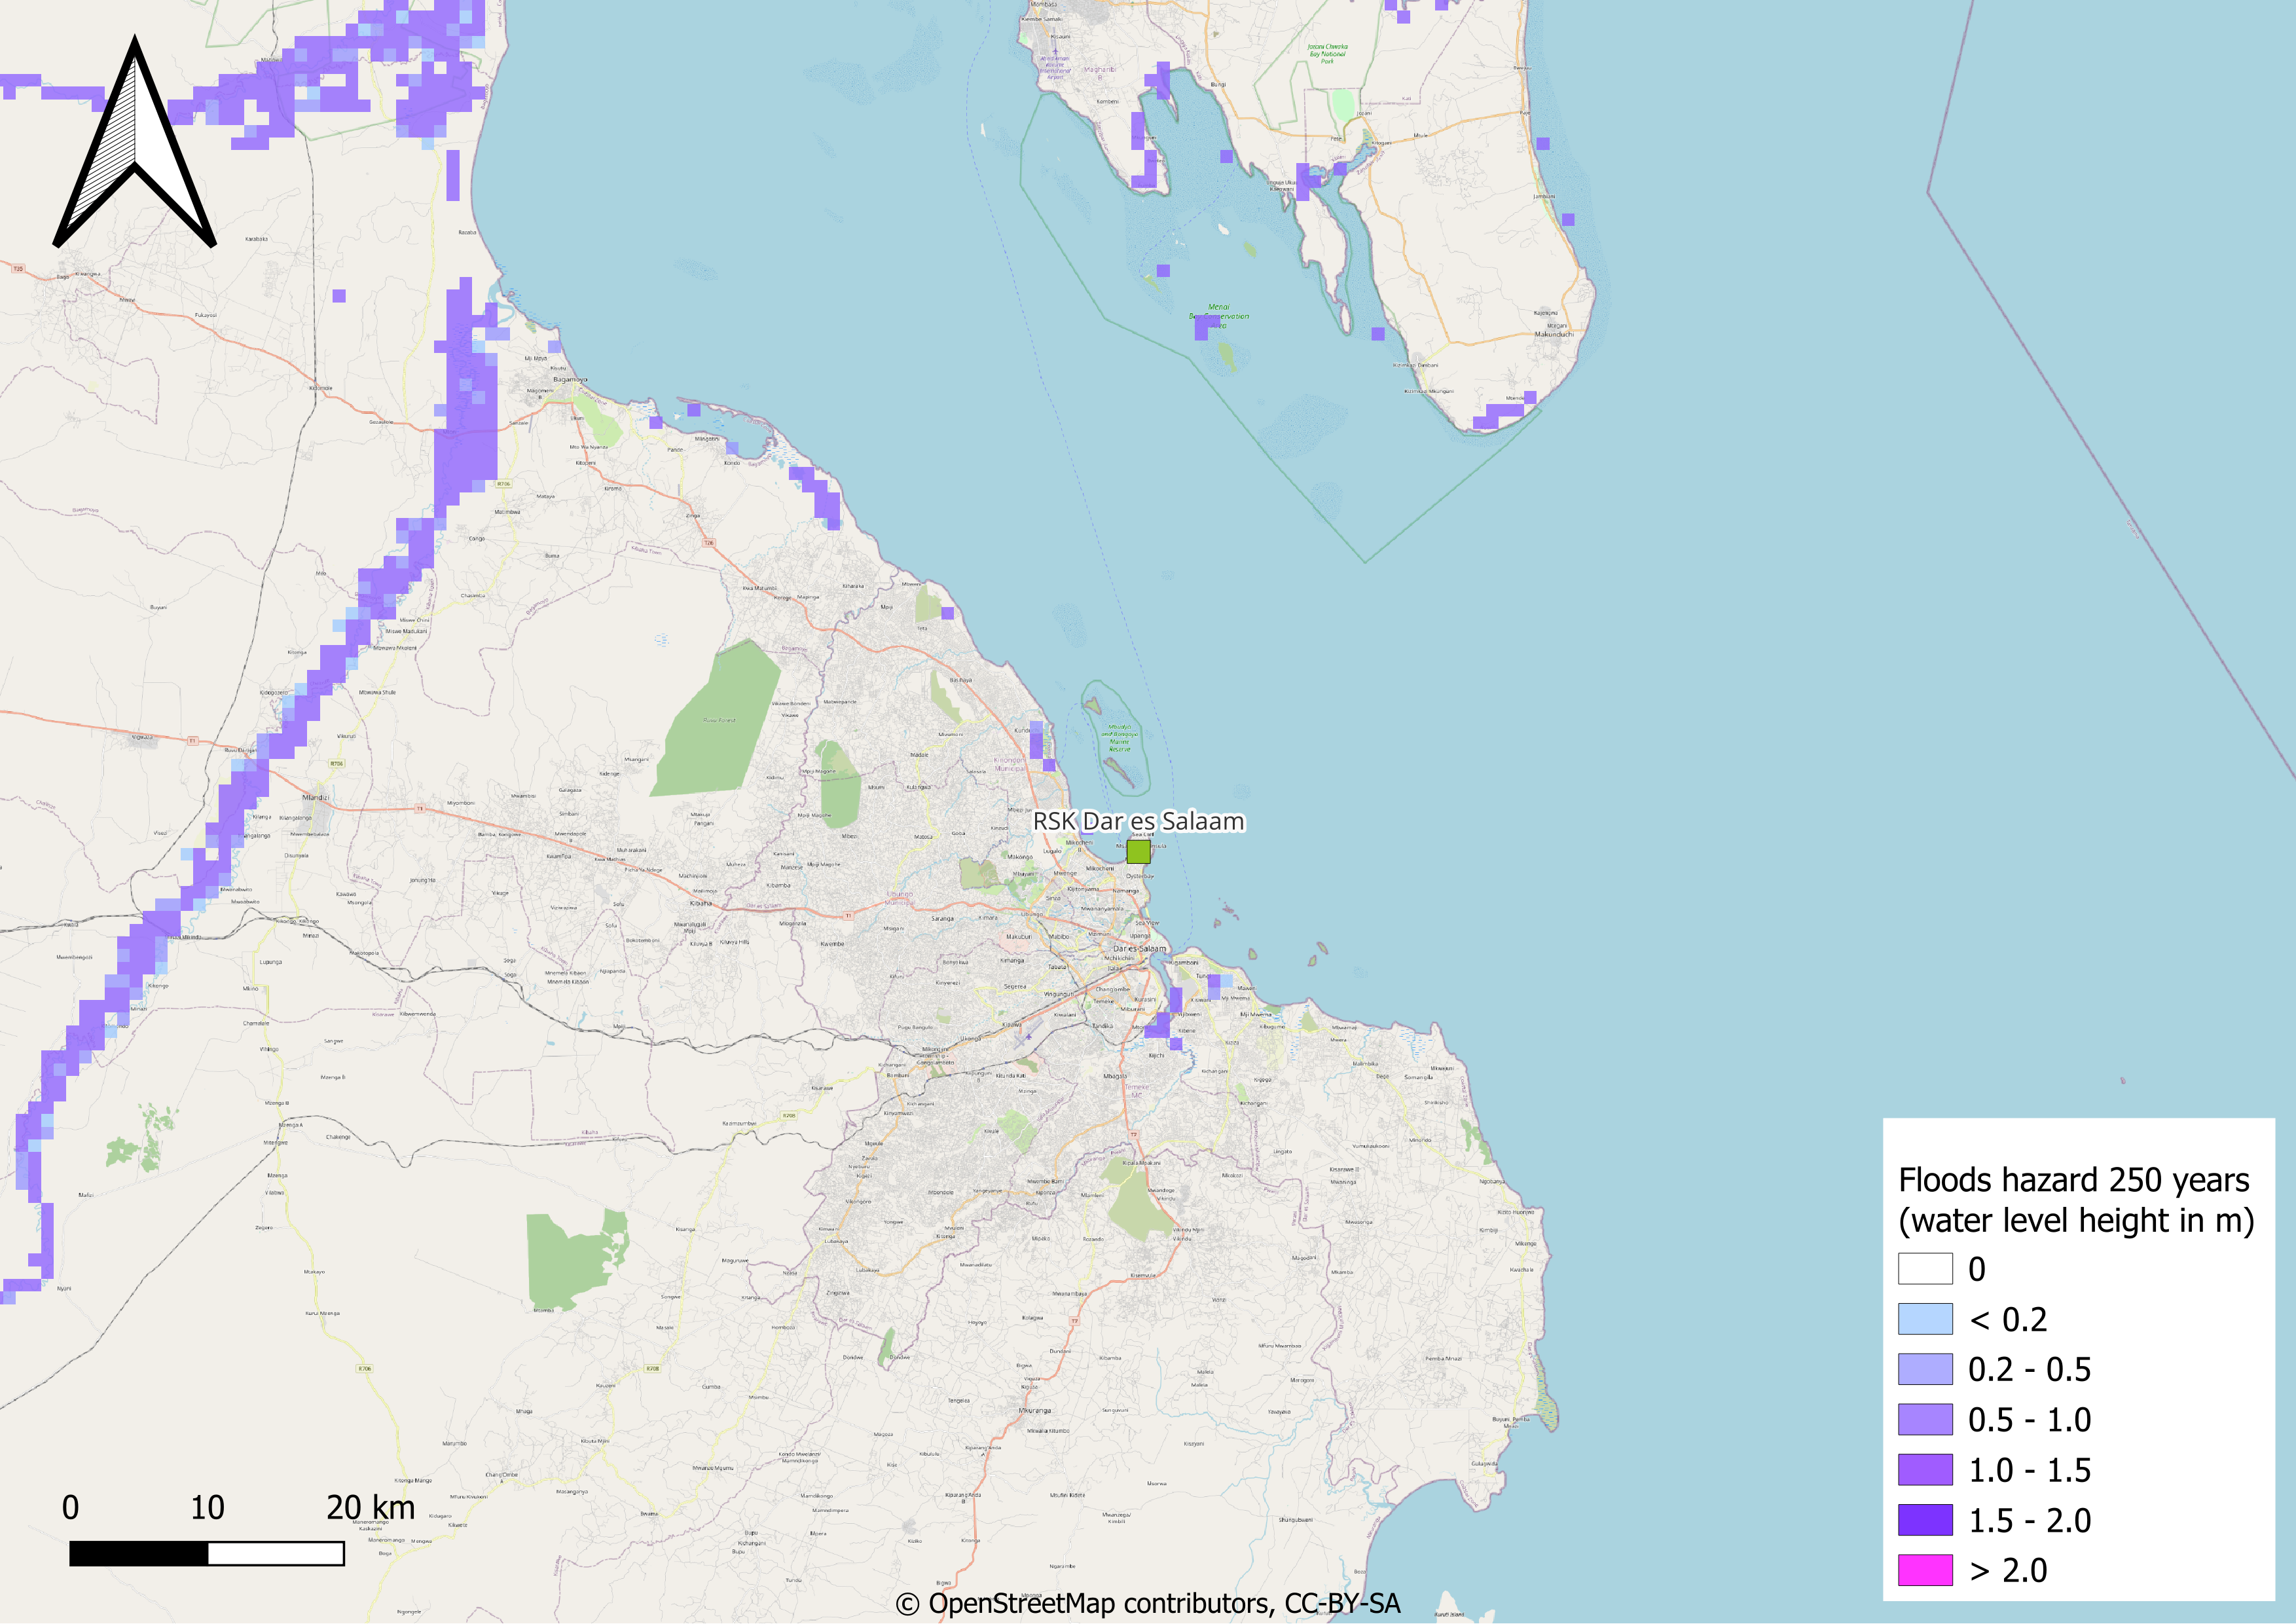
Present-day flood hazard in a 250 years return period in Dar es Salaam. The values are expected water level high in meters. The return period indicates that the flood of this magnitude is expected once every 250 years. Source: WRI - Aqueduct Floods.
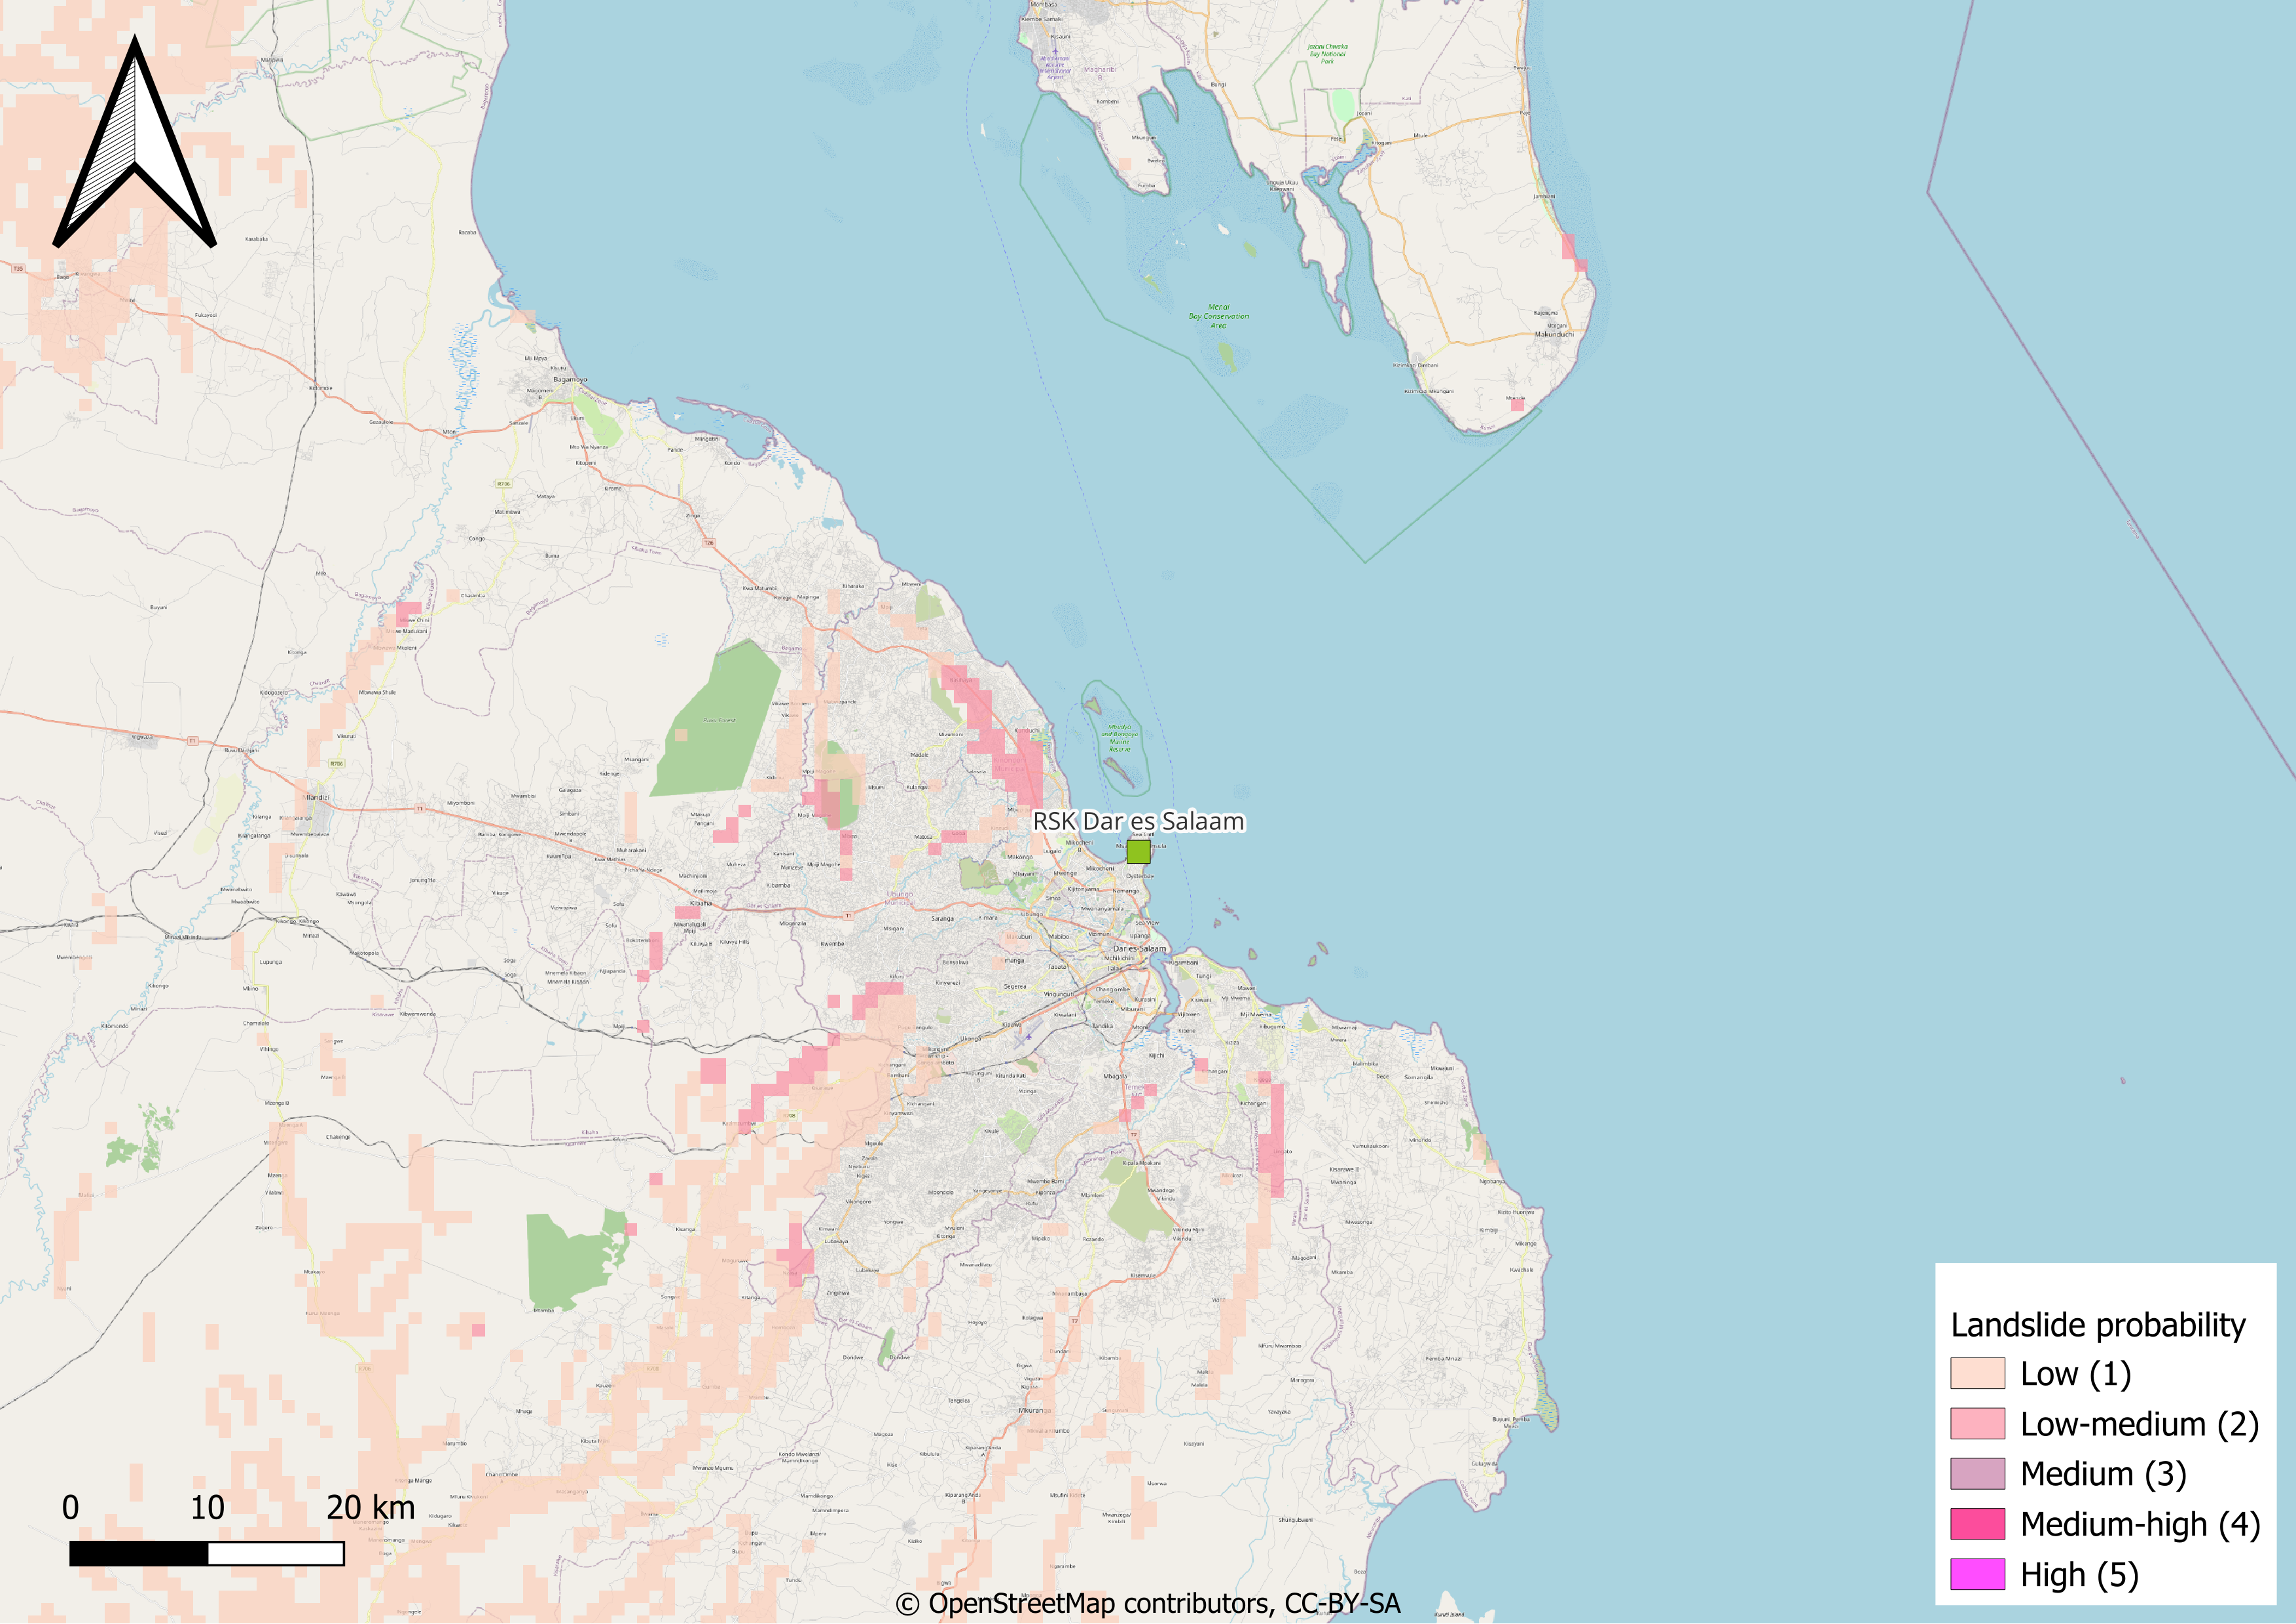
Present-day frequency of landslides triggered by precipitation meassured in expected annual probability and percentage of pixel of occurrence of a potentially destructive landslide event x 1000000. Source Global Assessment Report.

Tropical cyclones frequency in events per year is an estimate of the tropical cyclone frequency of Saffir-Simpson category 5. Source: IBTrACS processed by UNEP/GRID-Geneva.
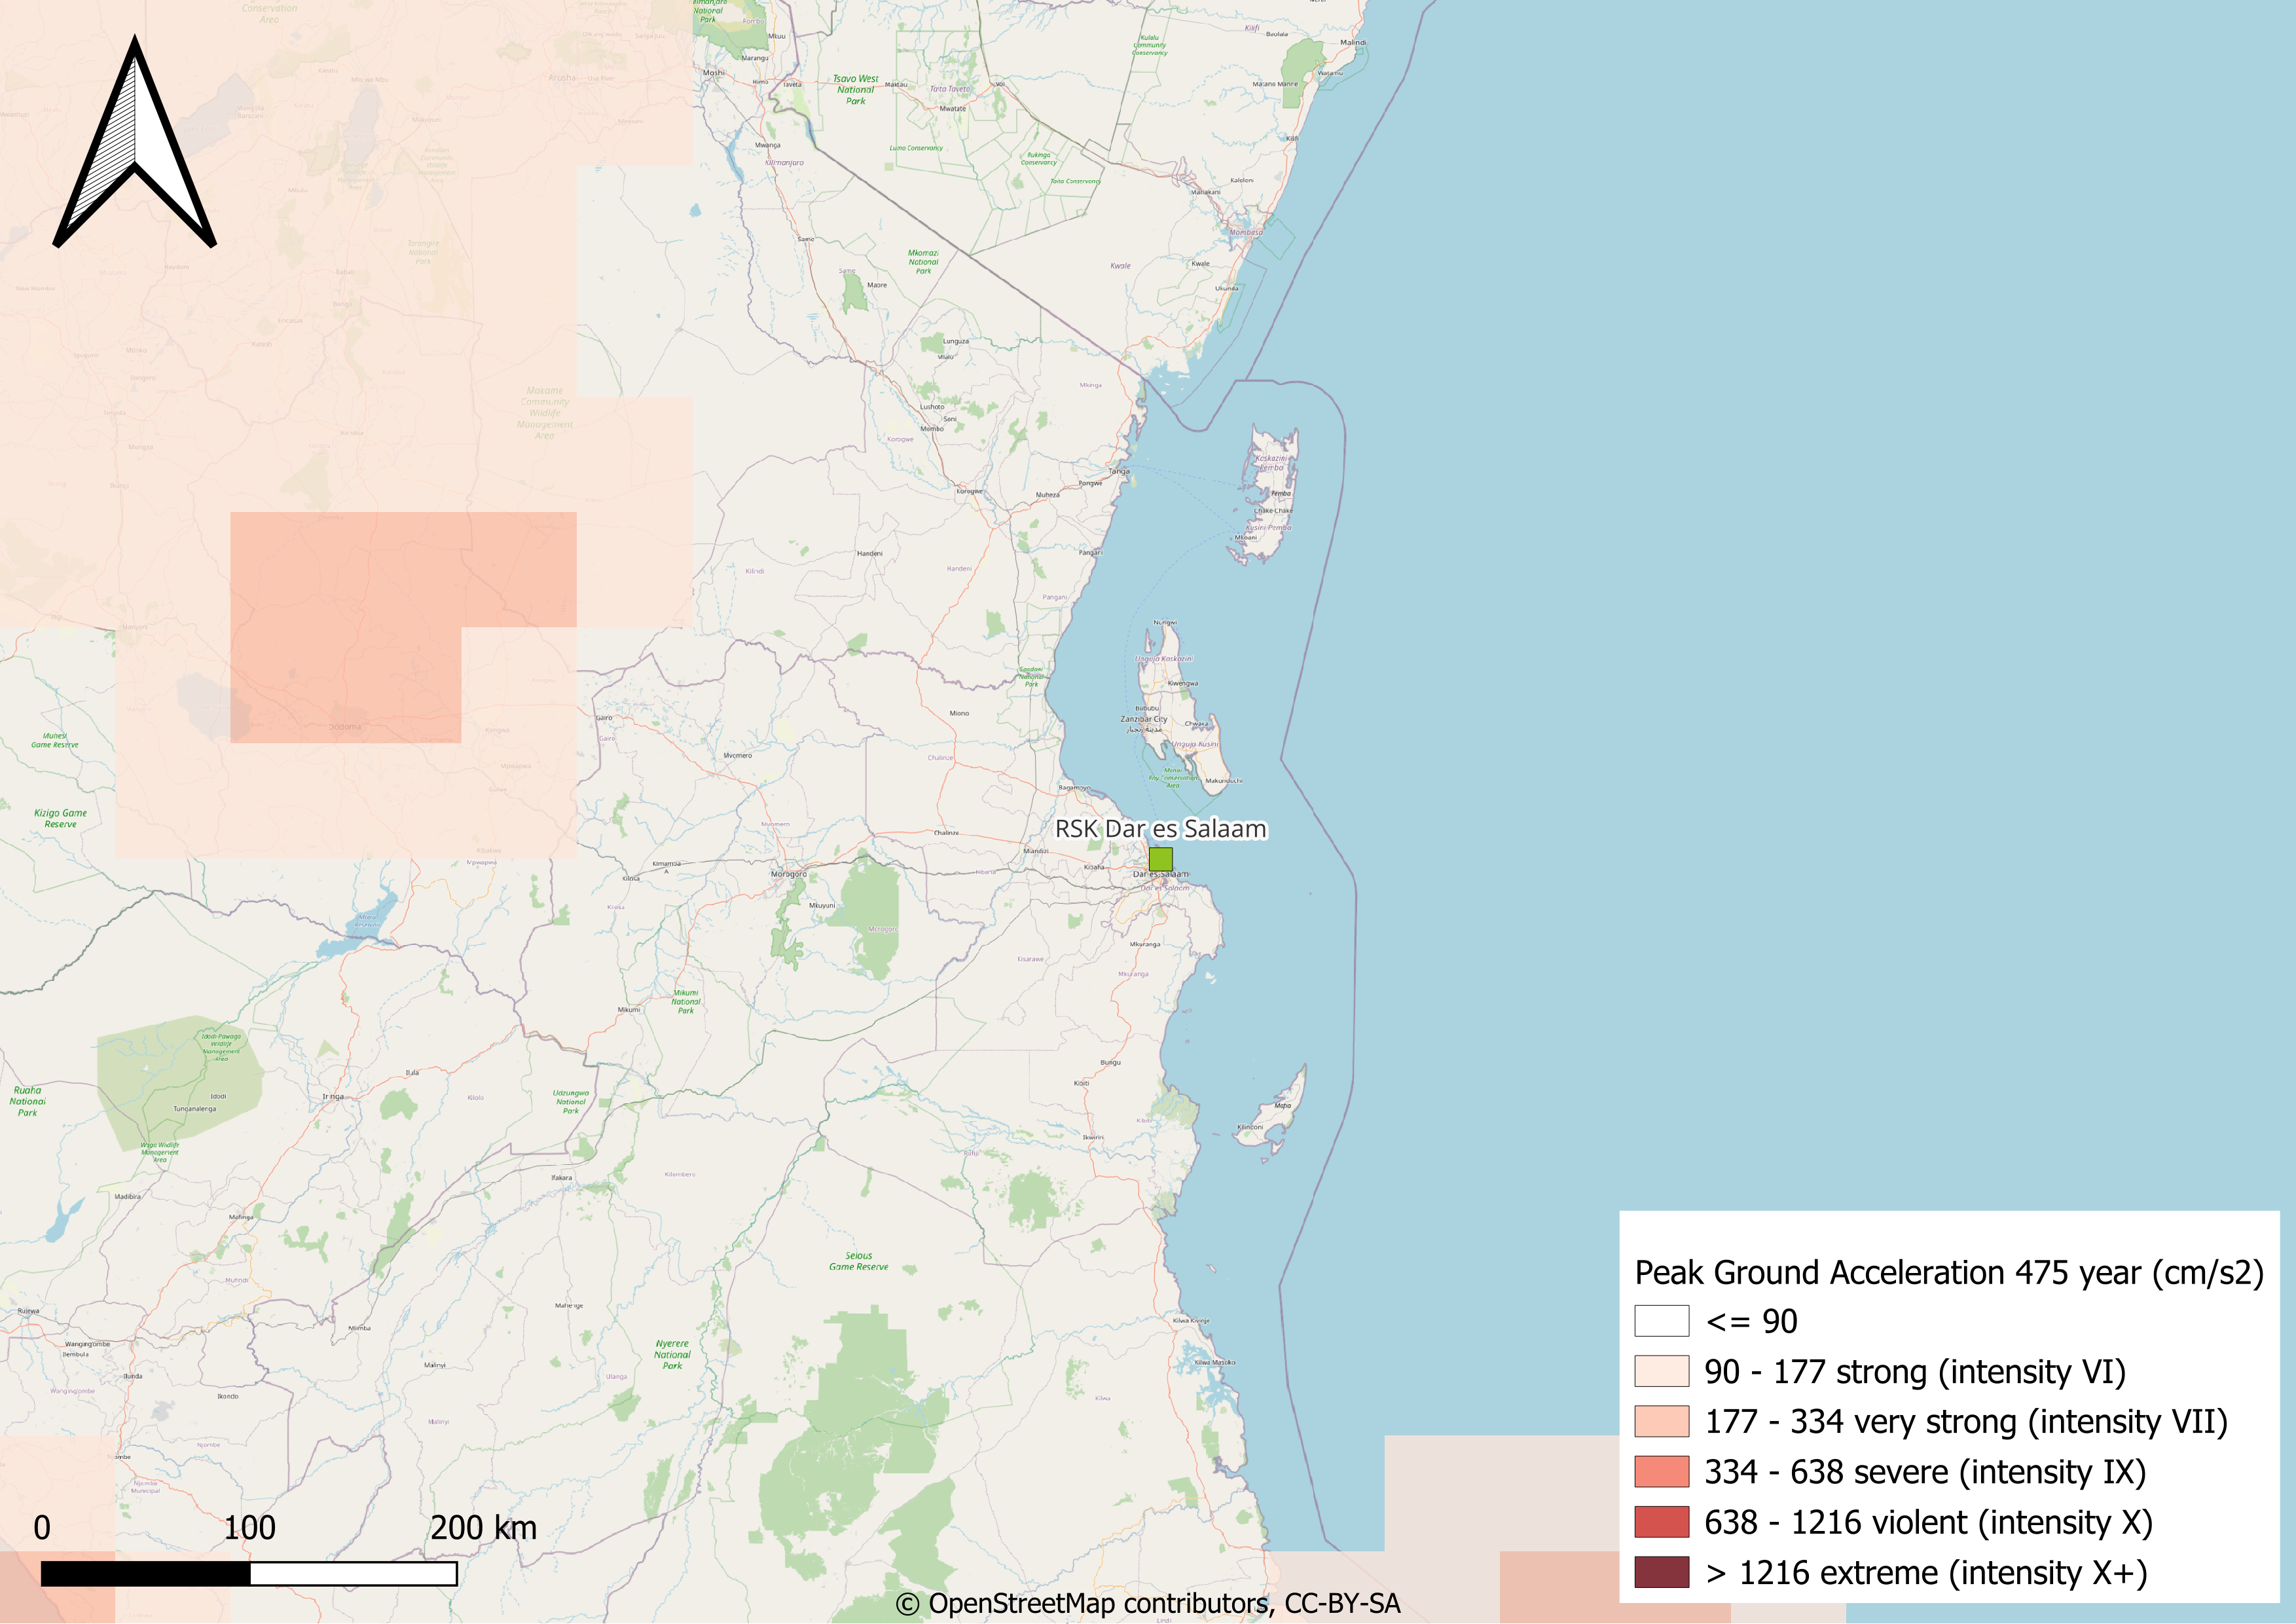
Estimated Peak Ground Acceleration (PGA) (cm/s2) in a 475 years retorn period earthquake in Dar es Salaam.
Projected Hazards
The baseline and projected future averaged value of each CID analyzed for this site is presented in the following table. The future projected values for years 2030 and 2050 are displayed for scenario RCP2.6 (green path) and RCP8.5 (unrestricted growth). The temporal evolution of the CID and the mean value for each time period are displayed by clicking on the CID name. Each climate-related hazard is evaluated in a specific section.
Climate Impact-Driver (chart link) |
Units |
Historical |
2030 | 2.6 |
2030 | 8.5 |
2050 | 2.6 |
2050 | 8.5 |
Source |
|---|---|---|---|---|---|---|---|
[-] |
1.1 |
1.1 |
1.1 |
1.0 |
1.0 |
||
days |
24.8 |
23.3 |
28.4 |
22.9 |
26.8 |
||
days |
21.1 |
20.8 |
21.5 |
21.5 |
20.3 |
||
°C |
28.2 |
29.4 |
29.6 |
29.8 |
30.6 |
||
°C |
28.3 |
29.4 |
29.6 |
29.9 |
30.6 |
||
°C |
25.6 |
26.7 |
26.9 |
27.2 |
27.9 |
||
°C |
22.2 |
23.3 |
23.5 |
23.8 |
24.5 |
||
°C |
2.6 |
2.6 |
2.7 |
2.7 |
2.6 |
||
mm yr-1 |
1684.5 |
1733.3 |
1730.9 |
1746.4 |
1768.1 |
||
days |
0.0 |
0.0 |
0.0 |
0.0 |
0.0 |
||
days |
360.0 |
360.0 |
360.0 |
360.0 |
360.0 |
||
days |
46.7 |
44.9 |
42.6 |
46.9 |
47.1 |
||
days |
0.0 |
0.0 |
0.0 |
0.0 |
0.0 |
||
mm |
92.2 |
100.4 |
87.3 |
109.7 |
108.3 |
||
mm |
195.6 |
205.0 |
179.0 |
221.1 |
221.3 |
||
°C |
32.0 |
33.3 |
33.6 |
33.7 |
34.5 |
||
°C |
28.2 |
29.5 |
29.6 |
30.0 |
30.7 |
||
°C |
25.1 |
26.3 |
26.4 |
26.7 |
27.5 |
||
°C |
22.4 |
23.7 |
23.9 |
24.1 |
24.8 |
||
°C |
26.8 |
27.9 |
28.1 |
28.4 |
29.1 |
||
°C |
26.8 |
27.9 |
28.1 |
28.4 |
29.1 |
||
m s-1 |
5.9 |
5.9 |
5.9 |
5.8 |
5.8 |
||
days |
187.5 |
186.4 |
181.5 |
186.2 |
186.8 |
||
mm yr-1 |
1697.2 |
1675.7 |
1577.7 |
1748.8 |
1784.3 |
||
mm yr-1 |
1033.0 |
1019.9 |
960.3 |
1064.4 |
1086.0 |
||
mm d-1 |
8.5 |
8.6 |
8.2 |
9.0 |
9.1 |
||
days |
359.4 |
360.0 |
360.0 |
360.0 |
360.0 |
||
mm |
1621.3 |
1598.8 |
1501.0 |
1670.6 |
1704.3 |
||
mm |
986.8 |
973.1 |
913.6 |
1016.8 |
1037.3 |
||
days |
360.0 |
360.0 |
360.0 |
360.0 |
360.0 |
||
days |
19.7 |
19.5 |
17.9 |
20.8 |
20.9 |
CIDs with the (bc) suffix correspond to the biased corrected variables. The bias factors and corrections applied are described in the next table.
Climate Impact-Driver |
Modelled |
Observed |
Deviation |
Factor |
Delta |
|---|---|---|---|---|---|
Daily maximum near surface air temperature |
28.23 |
28.30 |
-0.24 % |
0.07 °C |
|
Daily minimum near surface air temperature |
25.61 |
22.20 |
15.37 % |
-3.41 °C |
|
Near surface air temperature |
26.81 |
26.80 |
0.03 % |
-0.01 °C |
|
Precipitation |
1697.22 |
1033.00 |
64.30 % |
0.61 [-] |
Mean temperature
The city of Dar es Salaam is projected to suffer a quite significant increment in average temperature. In fact, even if the percentage is not such noteworthy, the absolute rise spans between 1 ºC and more than 2 ºC, with average temperatures in the city exceeding 29 ºC.
Climate Impact-Driver (chart link) |
Historical |
2030 | 2.6 change |
2030 | 8.5 change |
2050 | 2.6 change |
2050 | 8.5 change |
Source |
|---|---|---|---|---|---|---|
26.8 °C |
No Change |
No Change |
Increase |
Increase |
Extreme Heat
Just as reflected by the temperature rise, the increase in extreme heat is expected to be significant. Average daily maximum temperatures might exceed the 30 ºC, the average daily temperatures are projected exceed 25 ºC year-round, as represented by the increase in summer days, while the number of tropical nights (days with minimum temperatures exceeding 20 ºC) are not projected to vary.
Climate Impact-Driver (chart link) |
Historical |
2030 | 2.6 - impact on hazard |
2030 | 8.5 - impact on hazard |
2050 | 2.6 - impact on hazard |
2050 | 8.5 - impact on hazard |
Source |
|---|---|---|---|---|---|---|
28.3 °C |
No Change |
No Change |
Increase |
Increase |
||
359.4 days |
No Change |
No Change |
No Change |
No Change |
||
360.0 days |
No Change |
No Change |
No Change |
No Change |
Cold spells and frosts
Located in a Tropical savanna climate, the cold spell and frost is not a relevant hazard for Dar as Salaam RSK office.
Climate Impact-Driver (chart link) |
Historical |
2030 | 2.6 - impact on hazard |
2030 | 8.5 - impact on hazard |
2050 | 2.6 - impact on hazard |
2050 | 8.5 - impact on hazard |
Source |
|---|---|---|---|---|---|---|
0.0 days |
No Change |
No Change |
No Change |
No Change |
||
0.0 days |
No Change |
No Change |
No Change |
No Change |
Mean precipitation
With small differences depending on the scenario analysed, the mean precipitations in the city of Dar es Salaam are expected to decrease in the medium-term and to slightly increase in the long-term.
Climate Impact-Driver (chart link) |
Historical |
2030 | 2.6 change |
2030 | 8.5 change |
2050 | 2.6 change |
2050 | 8.5 change |
Source |
|---|---|---|---|---|---|---|
1033.0 mm yr-1 |
No Change |
Decrease |
No Change |
Increase |
Floods and landslides
As a consequence of the future evolution in the precipitation patterns, the variation in floods and landslides depends on the scenario and the timeframe analysed. In the medium term, these hazards are expected not to vary significantly under the RCP2.6 scenario and to decrease under the RCP8.5 scenario. On the other side, in the long-term very heavy precipitation days are expected to increase, while maximum 1-day and maximum 5-days precipitations are projected to largely increase.
Climate Impact-Driver (chart link) |
Historical |
2030 | 2.6 - impact on hazard |
2030 | 8.5 - impact on hazard |
2050 | 2.6 - impact on hazard |
2050 | 8.5 - impact on hazard |
Source |
|---|---|---|---|---|---|---|
46.7 days |
No Change |
Decrease |
No Change |
No Change |
||
92.2 mm |
Increase |
Decrease |
Large Increase |
Large Increase |
||
195.6 mm |
No Change |
Decrease |
Large Increase |
Large Increase |
||
19.7 days |
No Change |
Decrease |
Increase |
Increase |
Aridity
As a consequence of the future evolution of precipitation patterns, it is not possible to observe a significant trend in the projections of aridity for Dar es Salaam. Overall, it can be said that aridity might decrease under the RCP2.6 scenario and increase under RCP8.5 scenario.
Climate Impact-Driver (chart link) |
Historical |
2030 | 2.6 - impact on hazard |
2030 | 8.5 - impact on hazard |
2050 | 2.6 - impact on hazard |
2050 | 8.5 - impact on hazard |
Source |
|---|---|---|---|---|---|---|
1.1 [-] |
No Change |
Increase |
No Change |
No Change |
||
24.8 days |
Decrease |
Large Increase |
Decrease |
Increase |
Drought
Similarly to aridity, it is not possible to observe a significant trend in the projections of droughts for Dar es Salaam. Overall, it can be said that droughts might decrease under the RCP2.6 scenario and increase under RCP8.5 scenario.
Climate Impact-Driver (chart link) |
Historical |
2030 | 2.6 - impact on hazard |
2030 | 8.5 - impact on hazard |
2050 | 2.6 - impact on hazard |
2050 | 8.5 - impact on hazard |
Source |
|---|---|---|---|---|---|---|
24.8 days |
Decrease |
Large Increase |
Decrease |
Increase |
||
187.5 days |
No Change |
No Change |
No Change |
No Change |
Wildfire
Overall, wildfire hazard in the city of Dar es Salaam is not expected to vary significantly.
Climate Impact-Driver (chart link) |
Historical |
2030 | 2.6 - impact on hazard |
2030 | 8.5 - impact on hazard |
2050 | 2.6 - impact on hazard |
2050 | 8.5 - impact on hazard |
Source |
|---|---|---|---|---|---|---|
24.8 days |
Decrease |
Large Increase |
Decrease |
Increase |
||
5.9 m s-1 |
No Change |
No Change |
No Change |
No Change |
||
187.5 days |
No Change |
No Change |
No Change |
No Change |
Coastal flood
Coastal flood in Dar es Salaam is expected to increase by 0.1m in the medium-term and by around 0.2m in the long-term.
CID |
2030 | 2.6 |
2030 | 8.5 |
2050 | 2.6 |
2050 | 8.5 |
|---|---|---|---|---|
Relative sea level rise |
0.1 |
0.2 |
0.11 |
0.24 |
Conclusions
The temperatures in the city of Dar es Salaam are expected to rise and reach - on average - 28 ºC or 29 ºC. This increase, although small in percentage, might lead to significant hazards and impacts in the city. On the other hand, extreme heat is not expected to vary significantly. According to future projections, rainfall will decrease in the medium-term and increase in the long-term. As a consequence, the hazards triggered by intense precipitations, landslides and floods, are expected to decrease by 2030 and to largely increase by 2050. Aridity and droughts are projected to depend to the scenario analysed: climate models shown that they might decrease under RCP2.6 scenario and to increase under RCP8.5 scenario. As for wildfire and wind-related hazards, they are not expected to vary significantly.
Finally, the coastal flood hazard is expected to increase under all the scenarios and for all the timeframes.
Hazard |
2030 | 2.6 - Estimated Physical Risk Change |
2030 | 8.5 - Estimated Physical Risk Change |
2050 | 2.6 - Estimated Physical Risk Change |
2050 | 8.5 - Estimated Physical Risk Change |
|---|---|---|---|---|
Extreme heat |
No Change |
No Change |
No Change |
No Change |
Cold spell and frost |
No Relevant |
No Relevant |
No Relevant |
No Relevant |
Floods |
No Change |
Decrease |
Large Increase |
Large Increase |
Landslide |
No Change |
Decrease |
Large Increase |
Large Increase |
Aridity |
Decrease |
Large Increase |
Decrease |
Increase |
Drought |
Decrease |
Increase |
Decrease |
Increase |
Wildfire |
No Change |
Increase |
No Change |
No Change |
Coastal flood |
Increase |
Increase |
Increase |
Increase |
Wind |
No Change |
No Change |
No Change |
No Change |