RSK Singapore
Background
Singapore is an equatorial island in the maritime Southeast Asia, comprised between the Strait of Malacca to the West, the Singapore Strait to the South, the South China Sea to the East, and the Straits of Johor to the North. The RSK office in Singapore is located in the central part of the island, at an elevation of 4 m above the sea level.
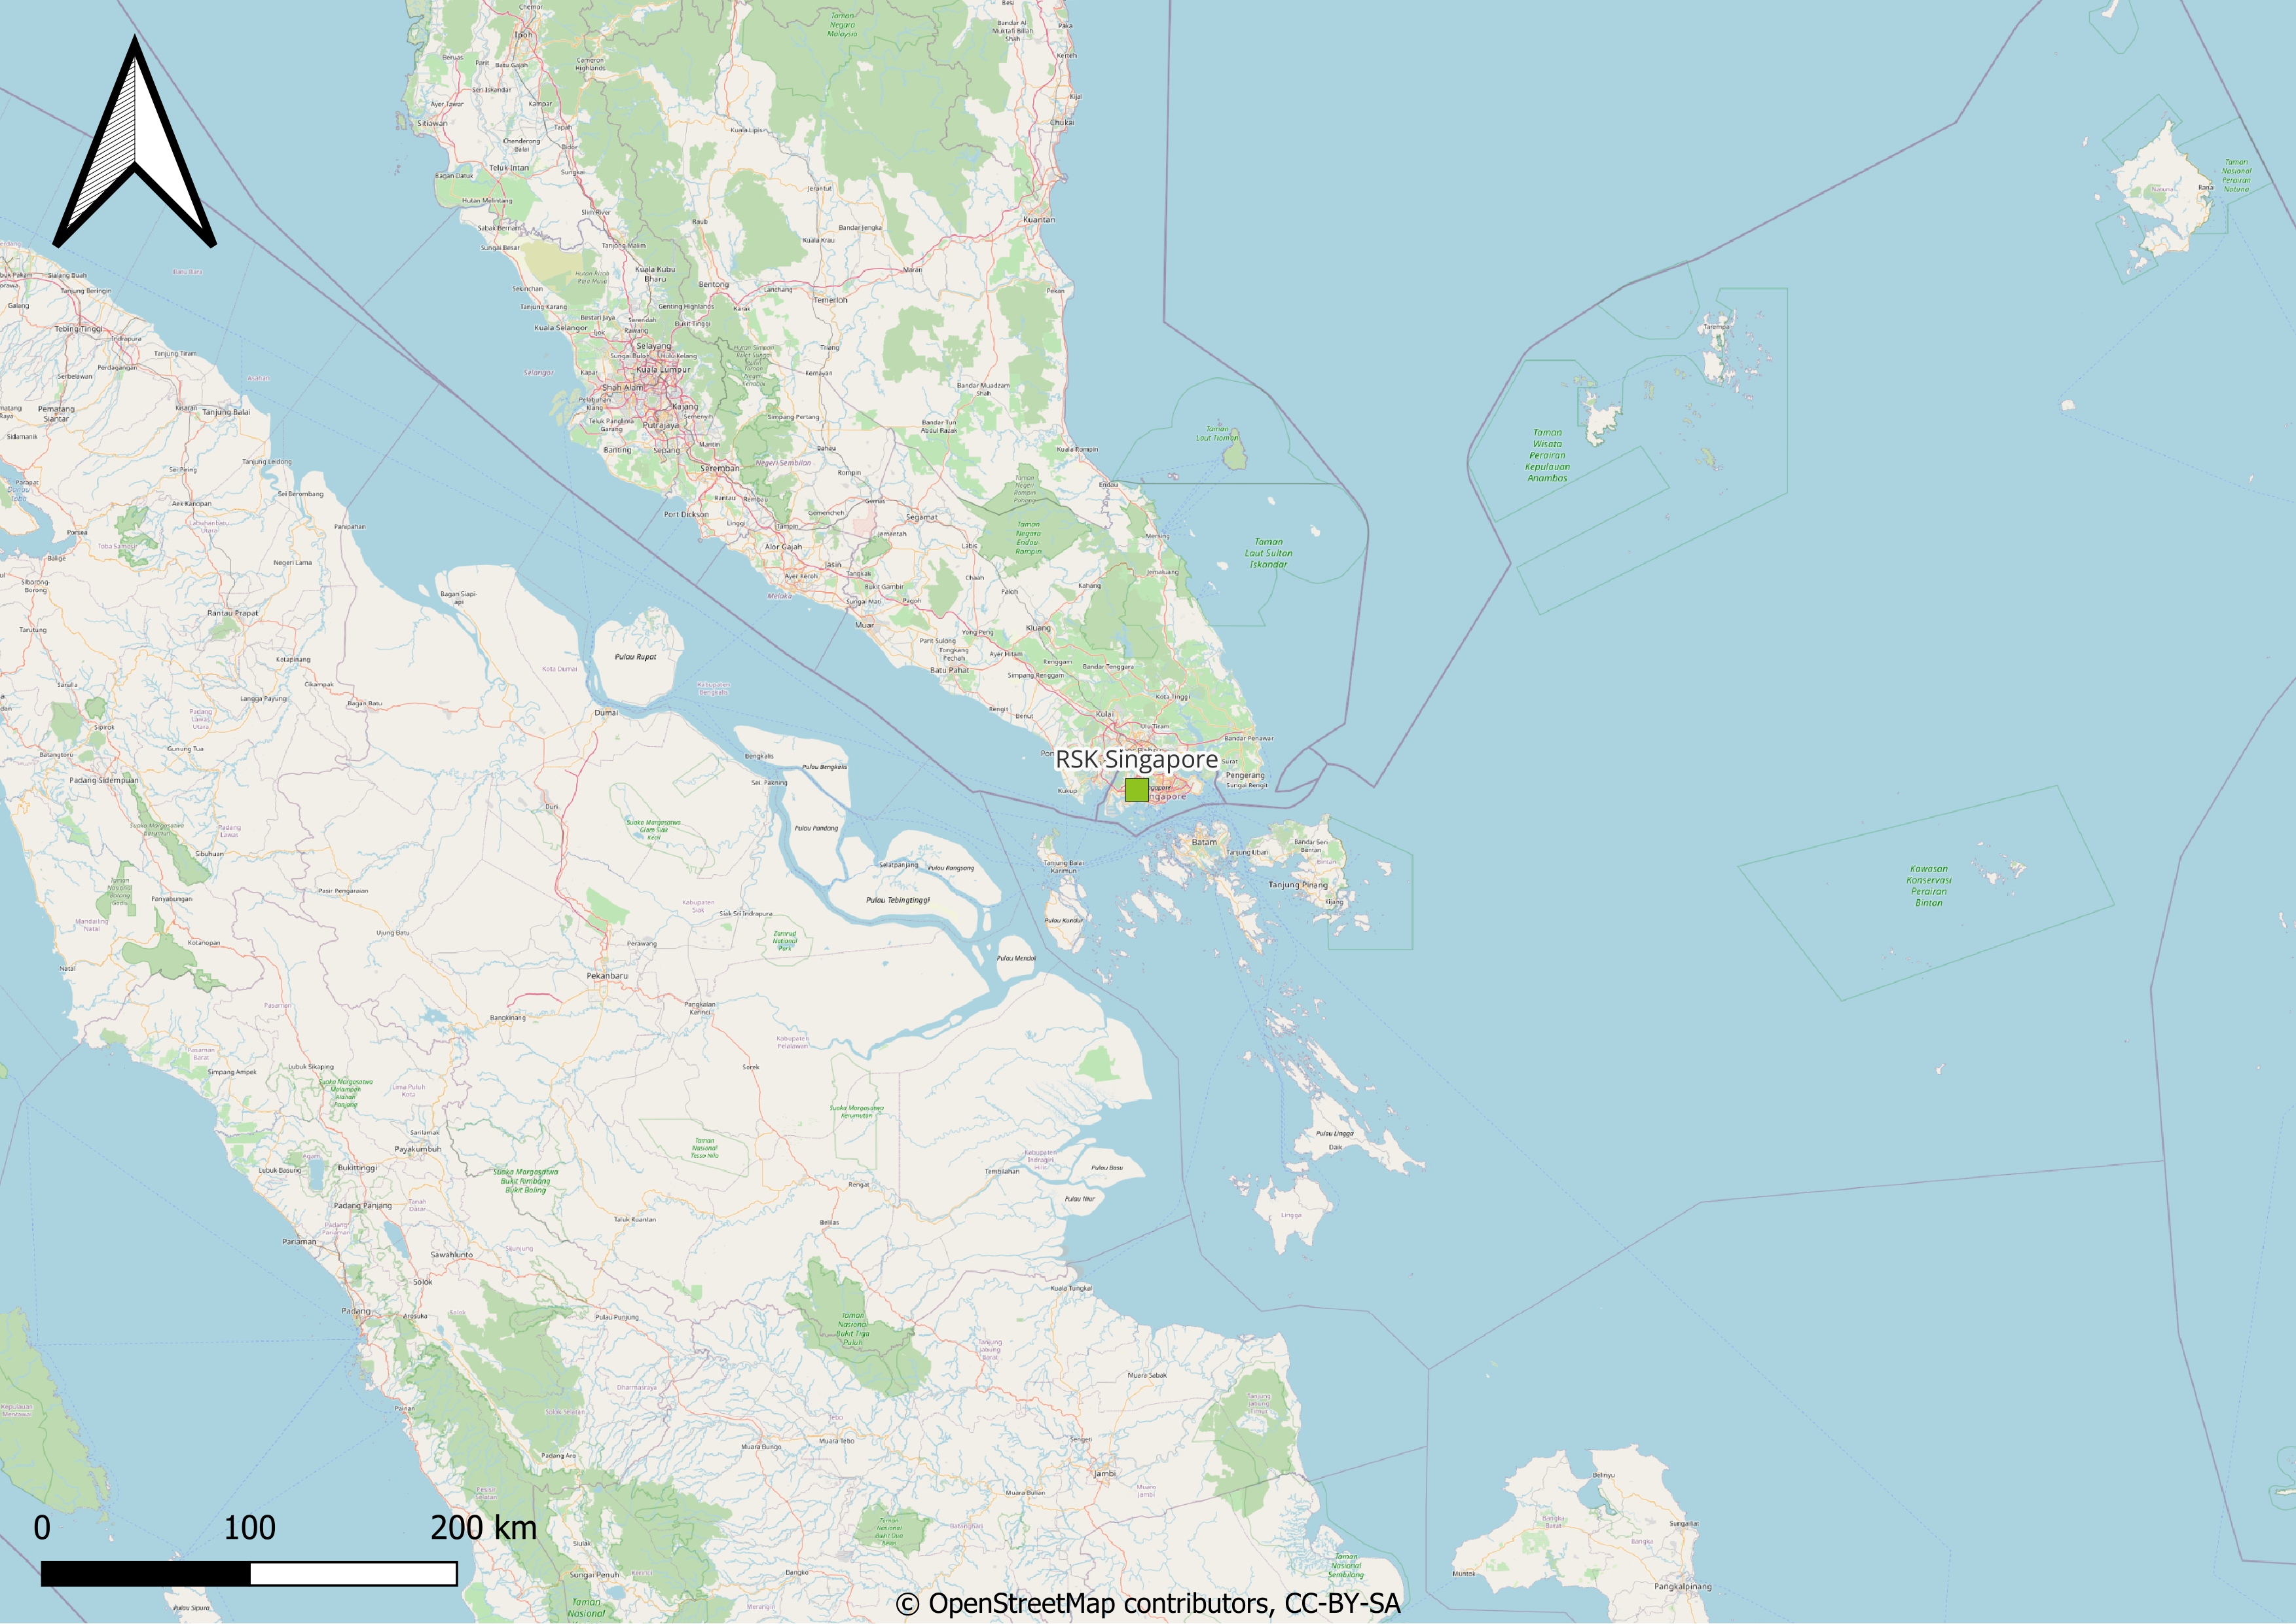
Location of the RSK office in Singapore.
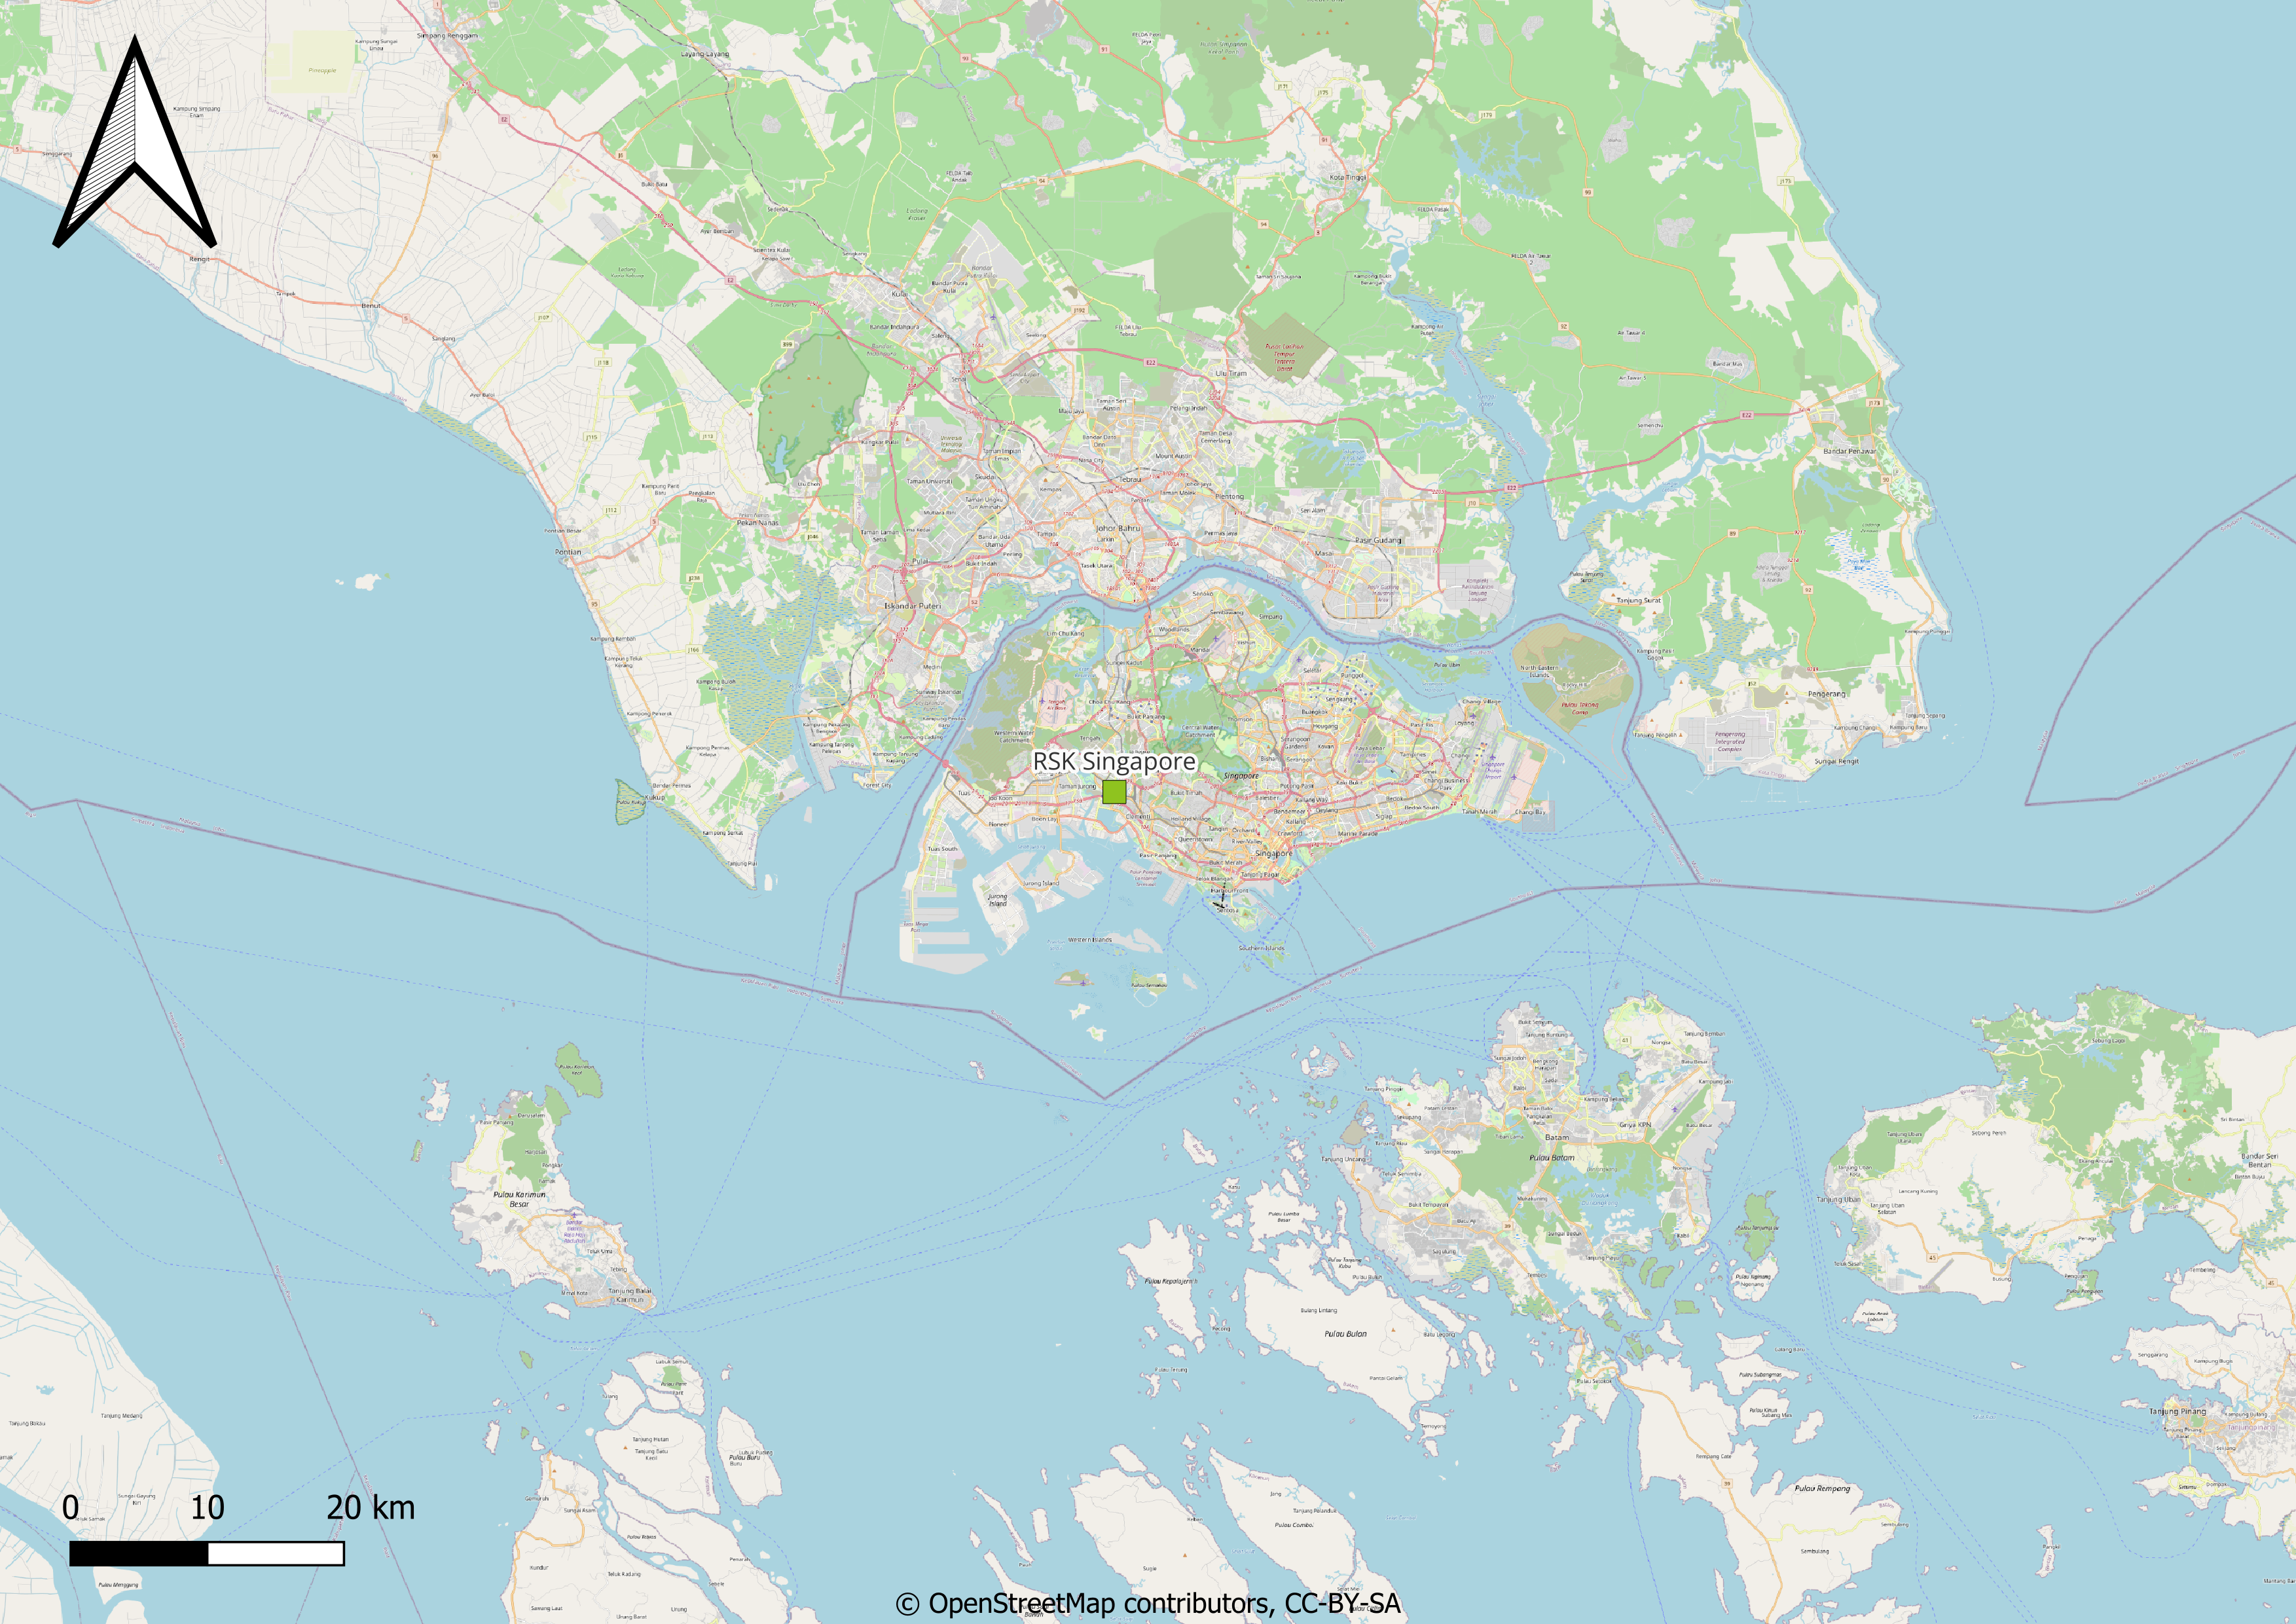
Detailed location of the RSK office in Singapore.
Natural risk past events
No climate-related past events or special adaptation measures have been reported from the Singapore facility.
Current Baseline
Singapore has a tropical rainforest climate (Af) without seasons, with uniform temperatures between 23 and 32 ºC, high humidity, and abundant rainfall (over 2000 mm/year). Precipitations are intense thoughout the year, with a wetter monsoon season from November to January.
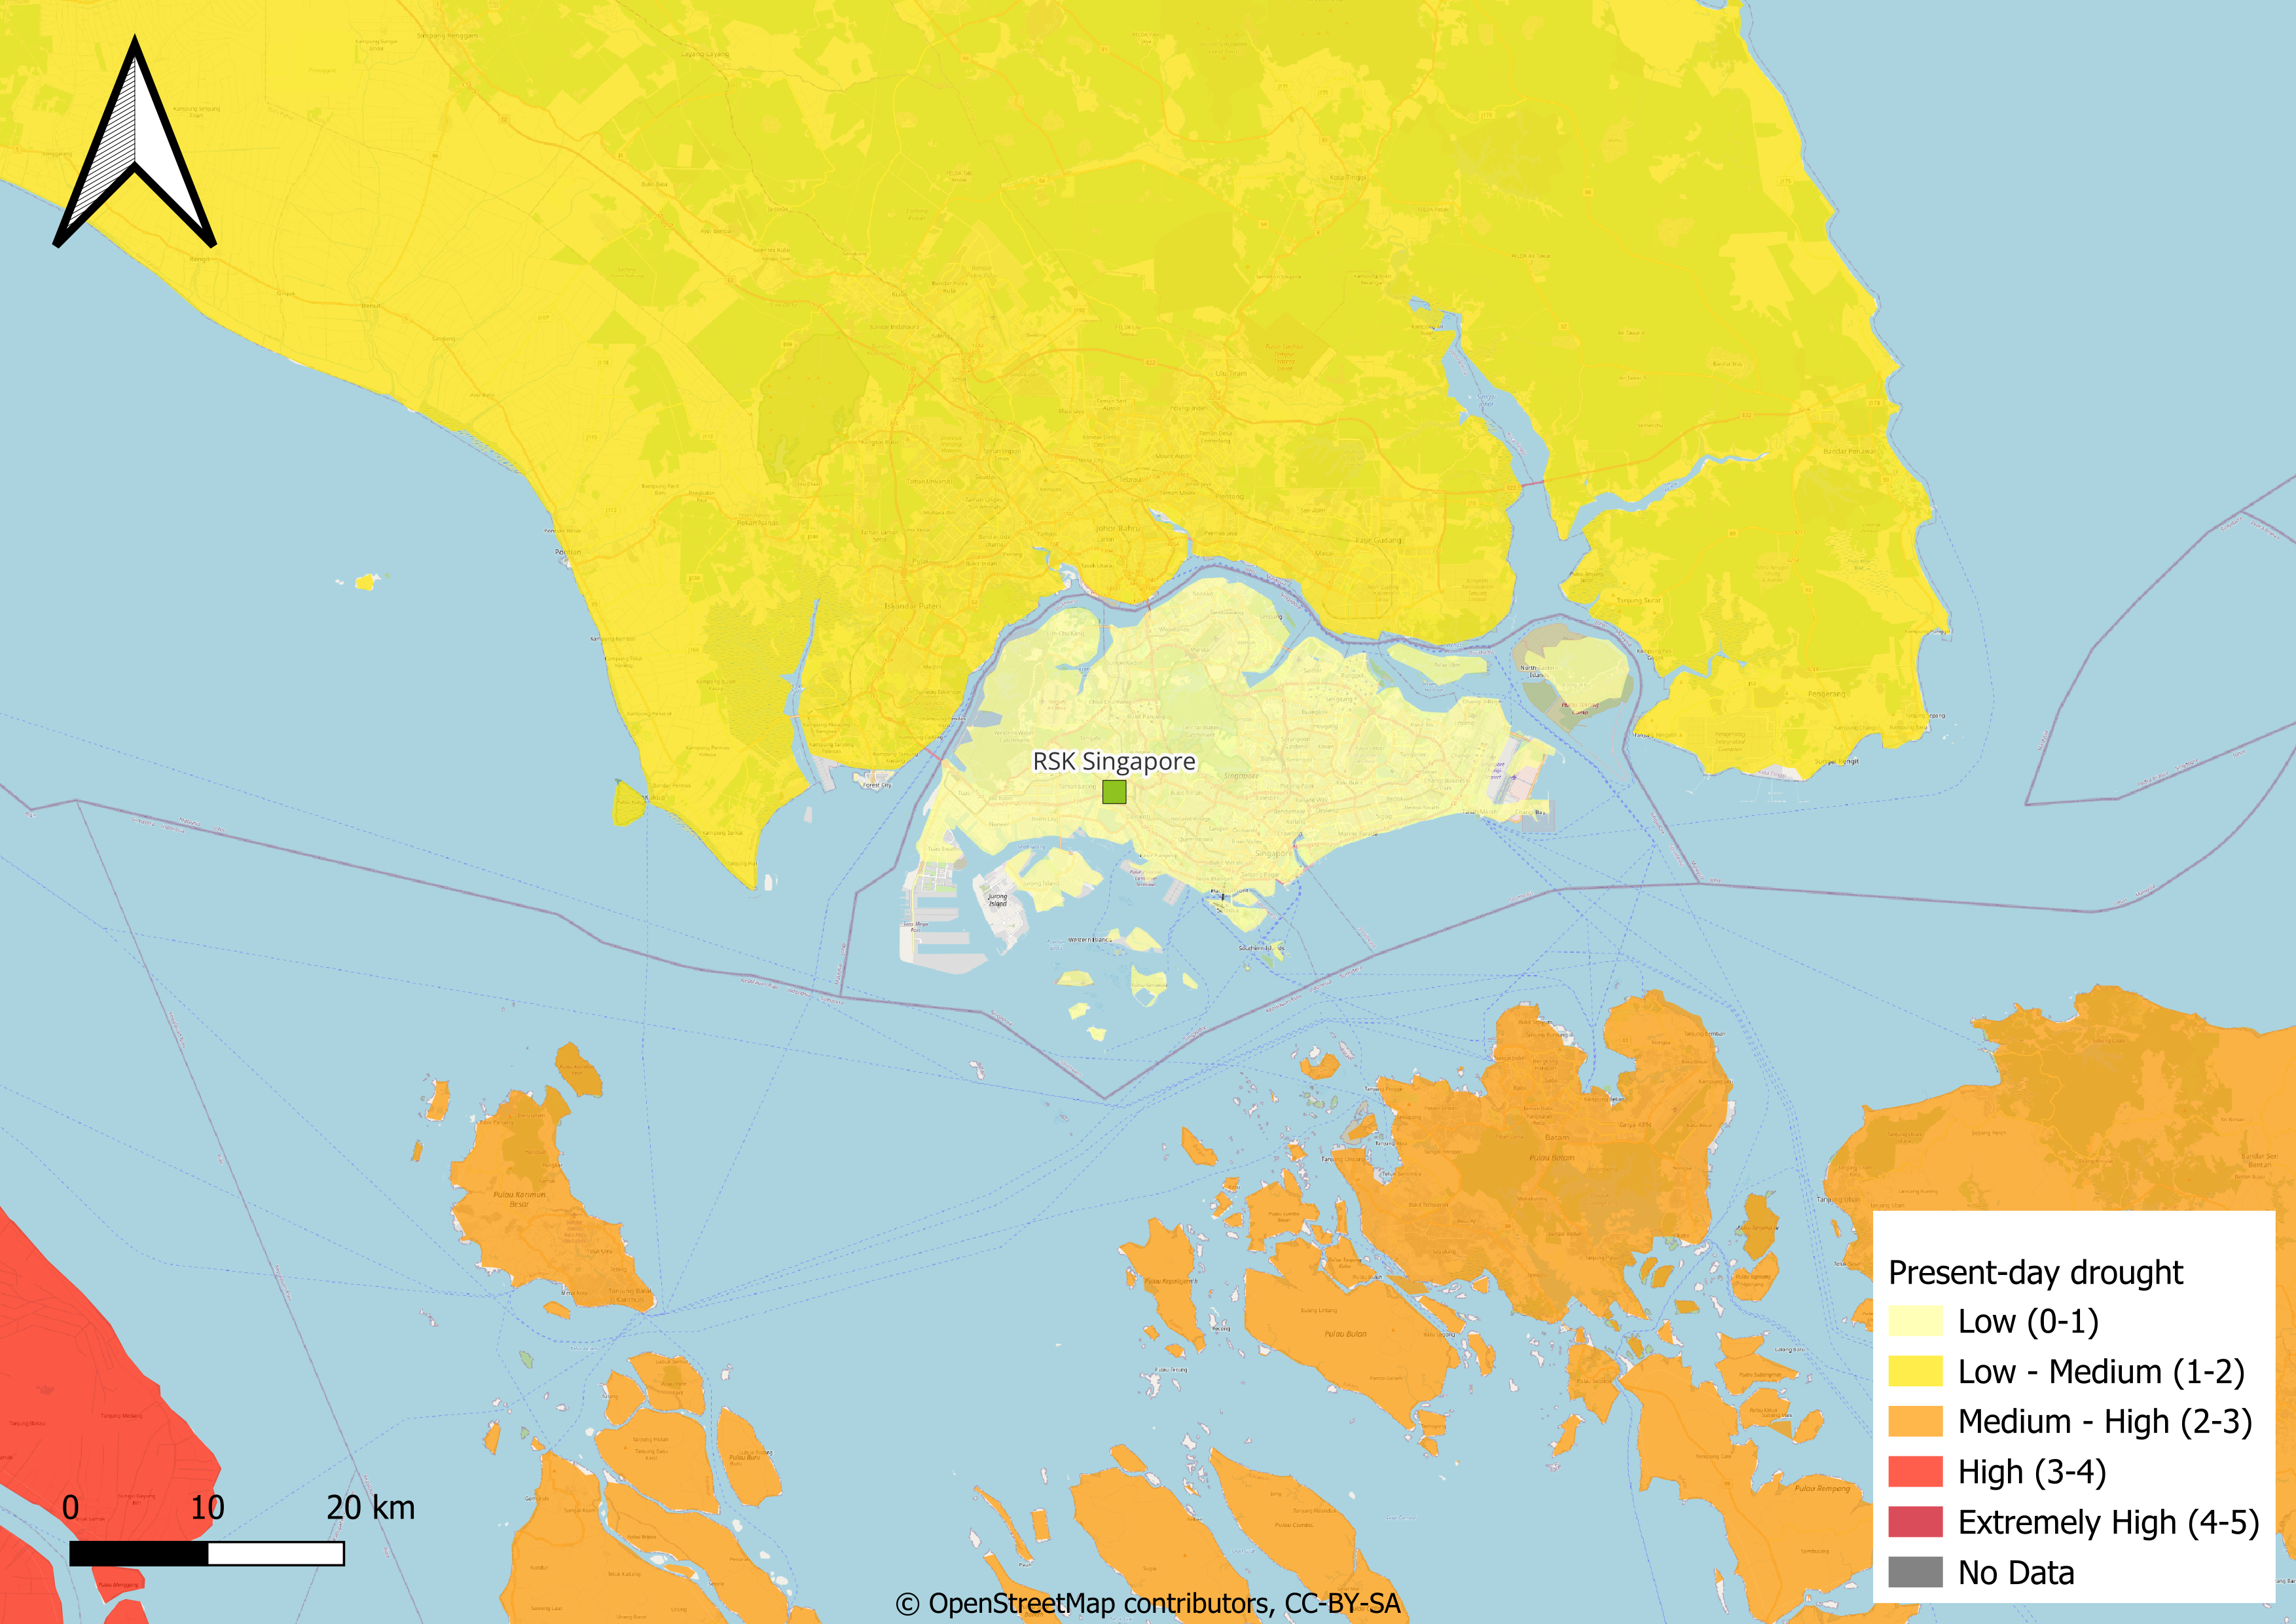
The current water stress of Singapore is low and the city has a low drought risk. Some parts of Singapore, and in particular coastal areas, are currently affected by river floodings, with potential limitations to traffic and products and services delivery. Due to its topography, Singapore is not affected by landslides. The city of Singapore is exposed to low earthquake hazard.
Variable |
Jan |
Feb |
Mar |
Apr |
May |
Jun |
Jul |
Aug |
Sep |
Oct |
Nov |
Dec |
Year |
|---|---|---|---|---|---|---|---|---|---|---|---|---|---|
Minimum temperature (°C) |
22.9 |
23.1 |
23.3 |
23.4 |
23.8 |
23.9 |
23.8 |
23.6 |
23.5 |
23.3 |
23.0 |
23.0 |
23.8 |
Maximum temperature (°C) |
29.9 |
30.5 |
30.8 |
31.2 |
31.2 |
31.0 |
30.7 |
30.6 |
30.6 |
30.8 |
30.1 |
29.5 |
28.2 |
Average temperature (°C) |
26.4 |
26.8 |
27.0 |
27.3 |
27.5 |
27.5 |
27.2 |
27.1 |
27.1 |
27.1 |
26.6 |
26.3 |
27.5 |
Precipitation (mm) |
211.0 |
183.0 |
180.0 |
197.0 |
175.0 |
172.0 |
157.0 |
161.0 |
175.0 |
203.0 |
253.0 |
295.0 |
2362.0 |
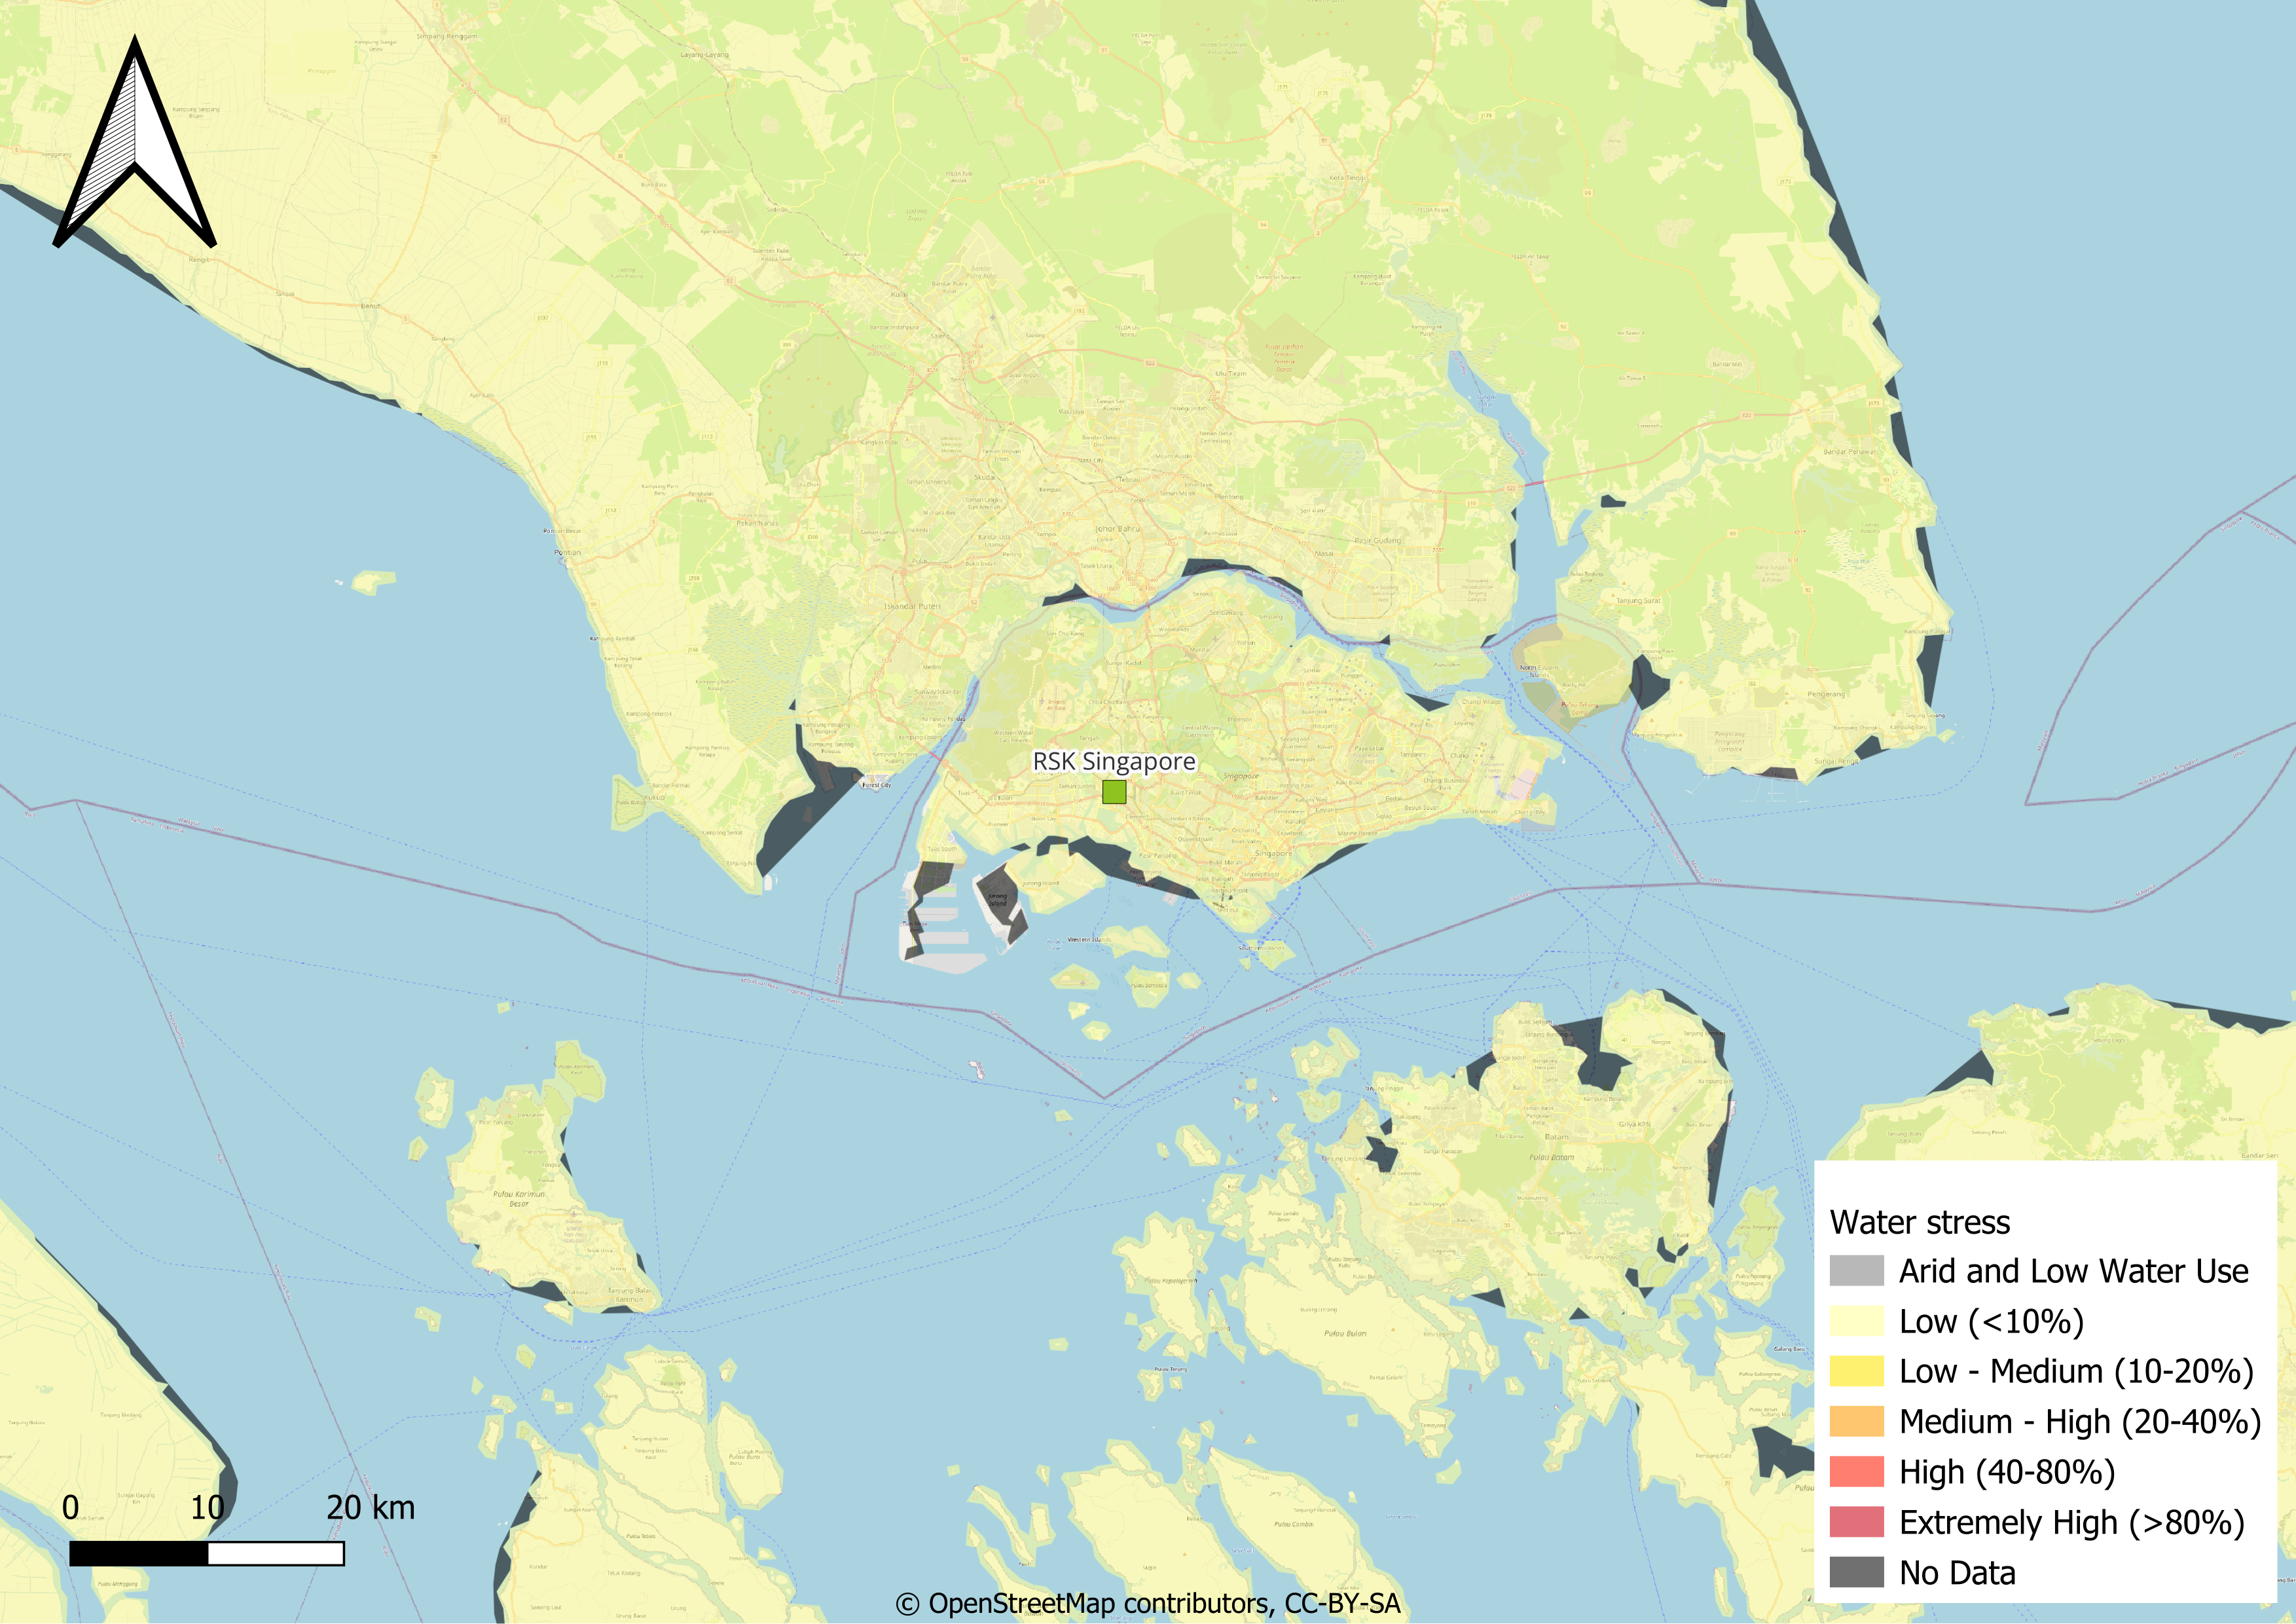
Present-day water stress in Singapore. Source: Aqueduct.
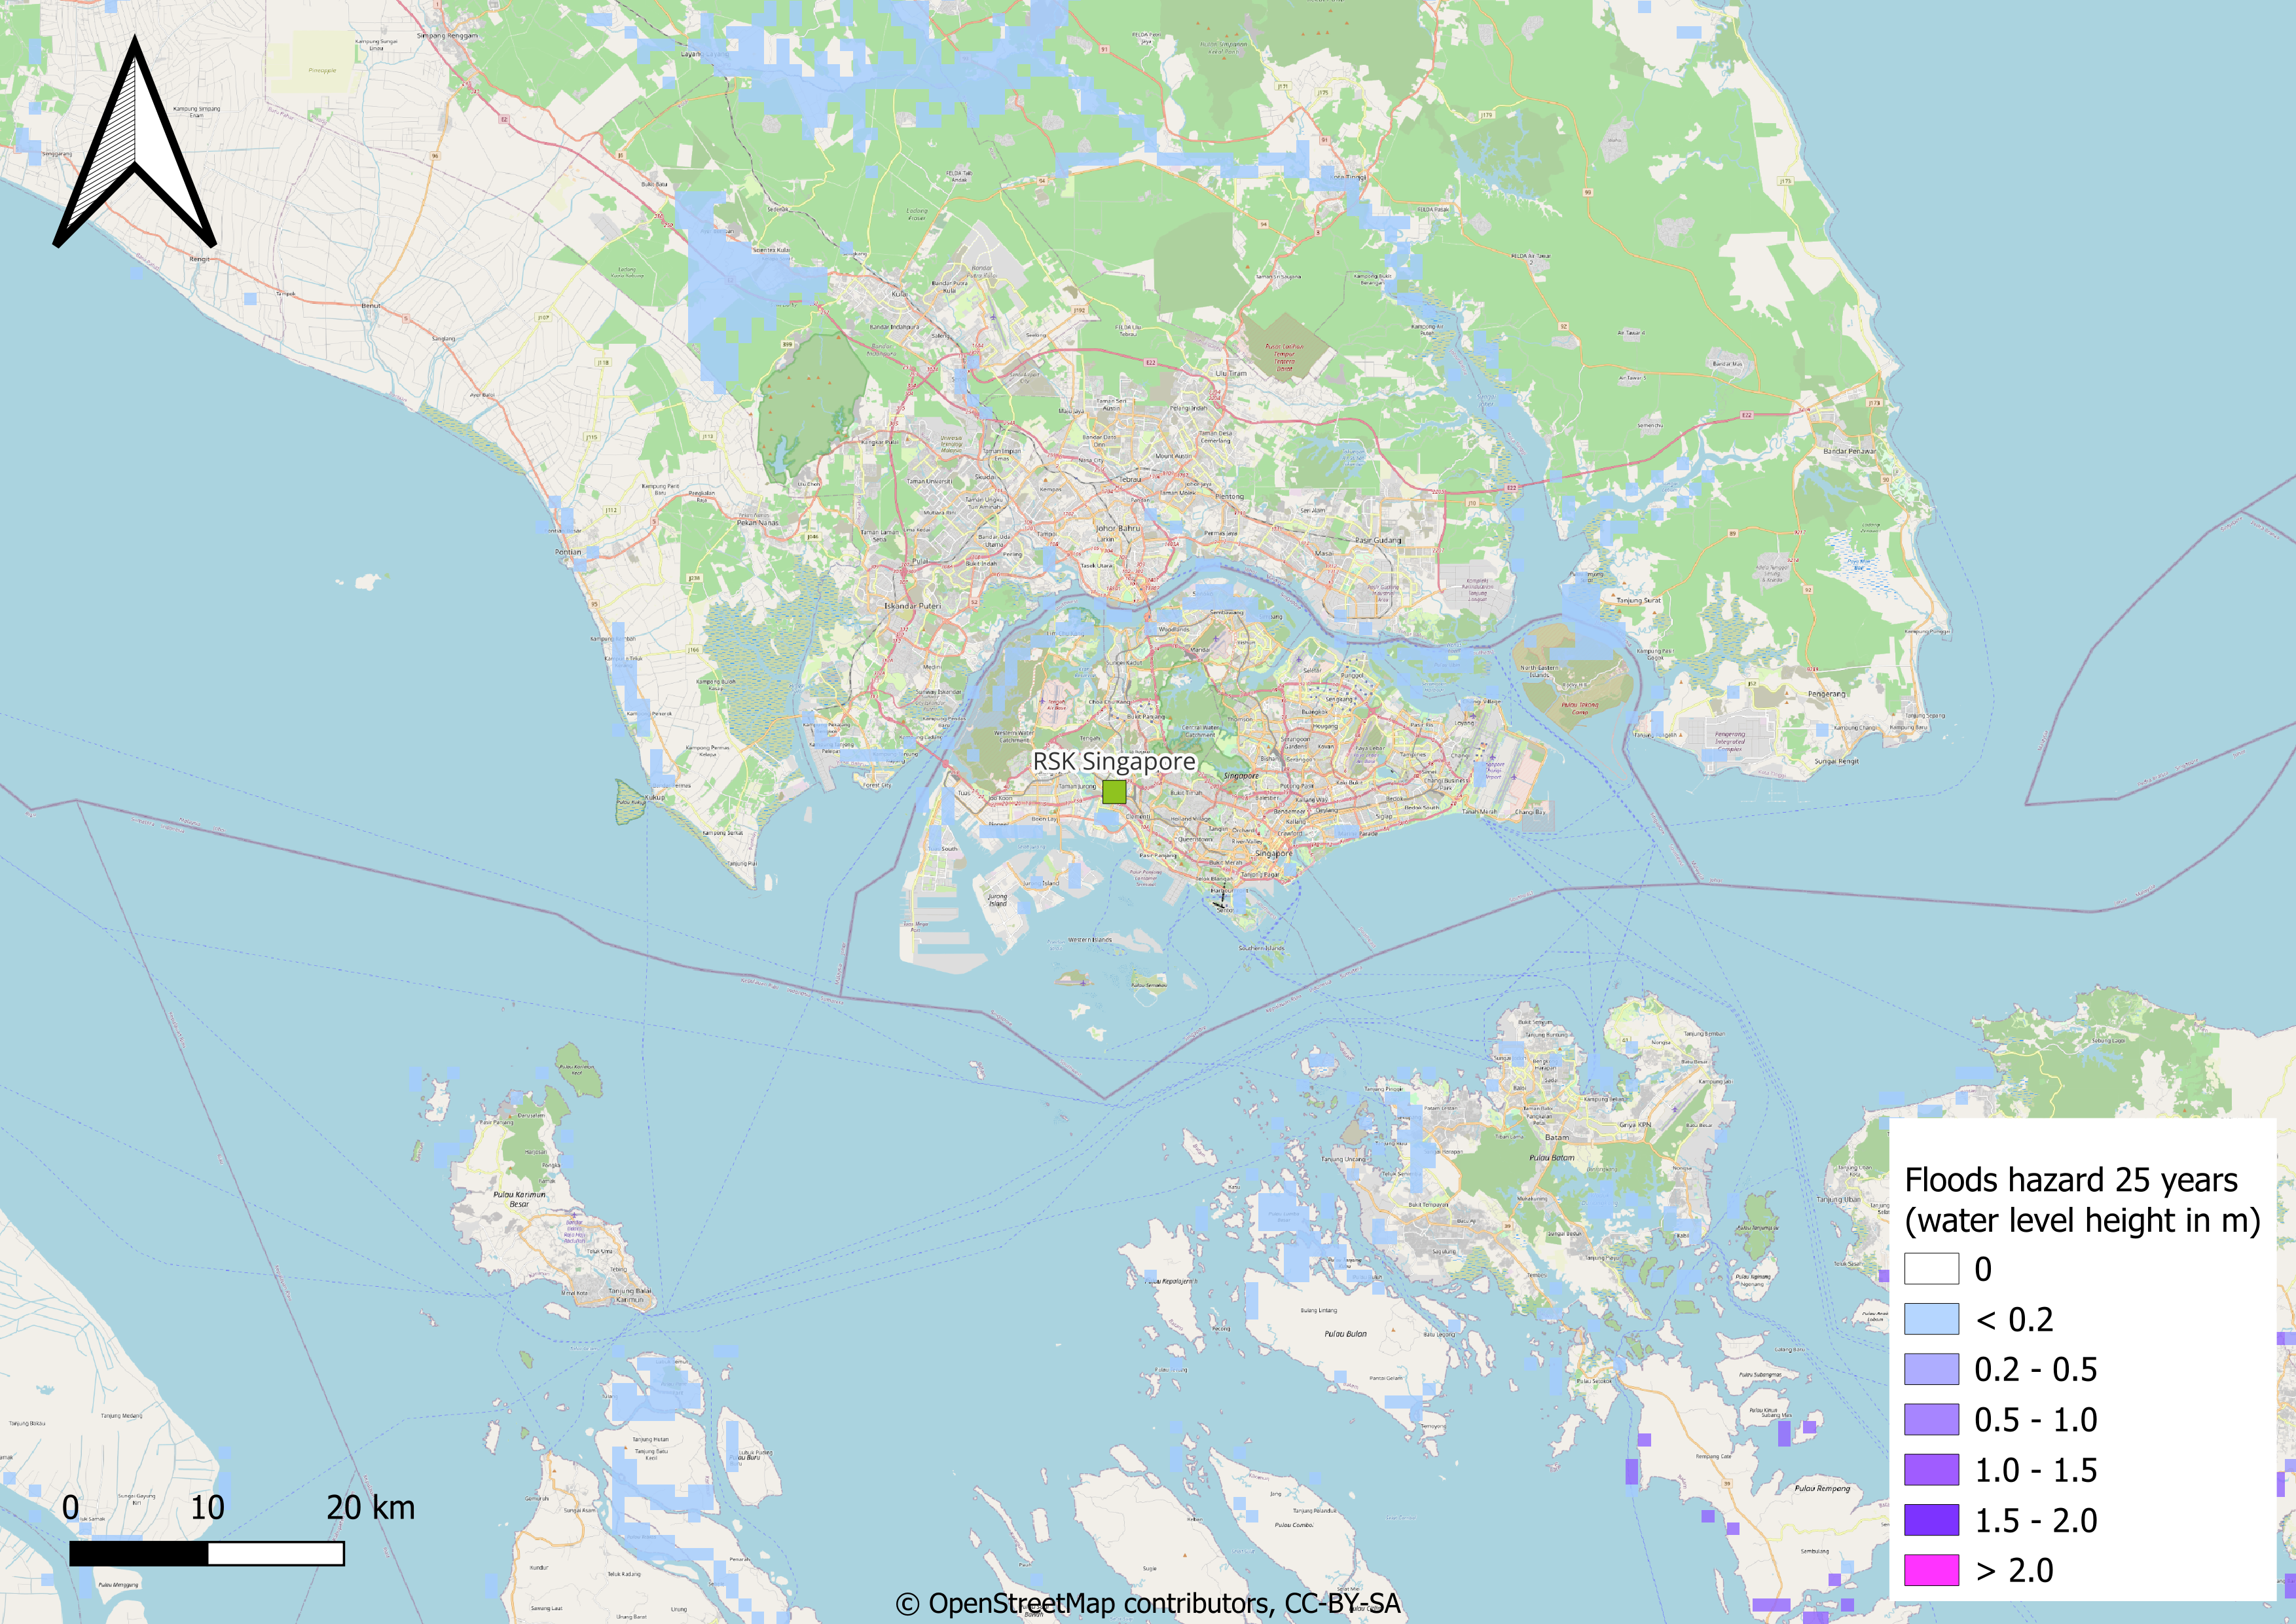
Present-day flood hazard in a 25 years return period in Singapore. The values are expected water level high in meters. The return period indicates that the flood of this magnitude is expected once every 25 years. Source: WRI - Aqueduct Floods.
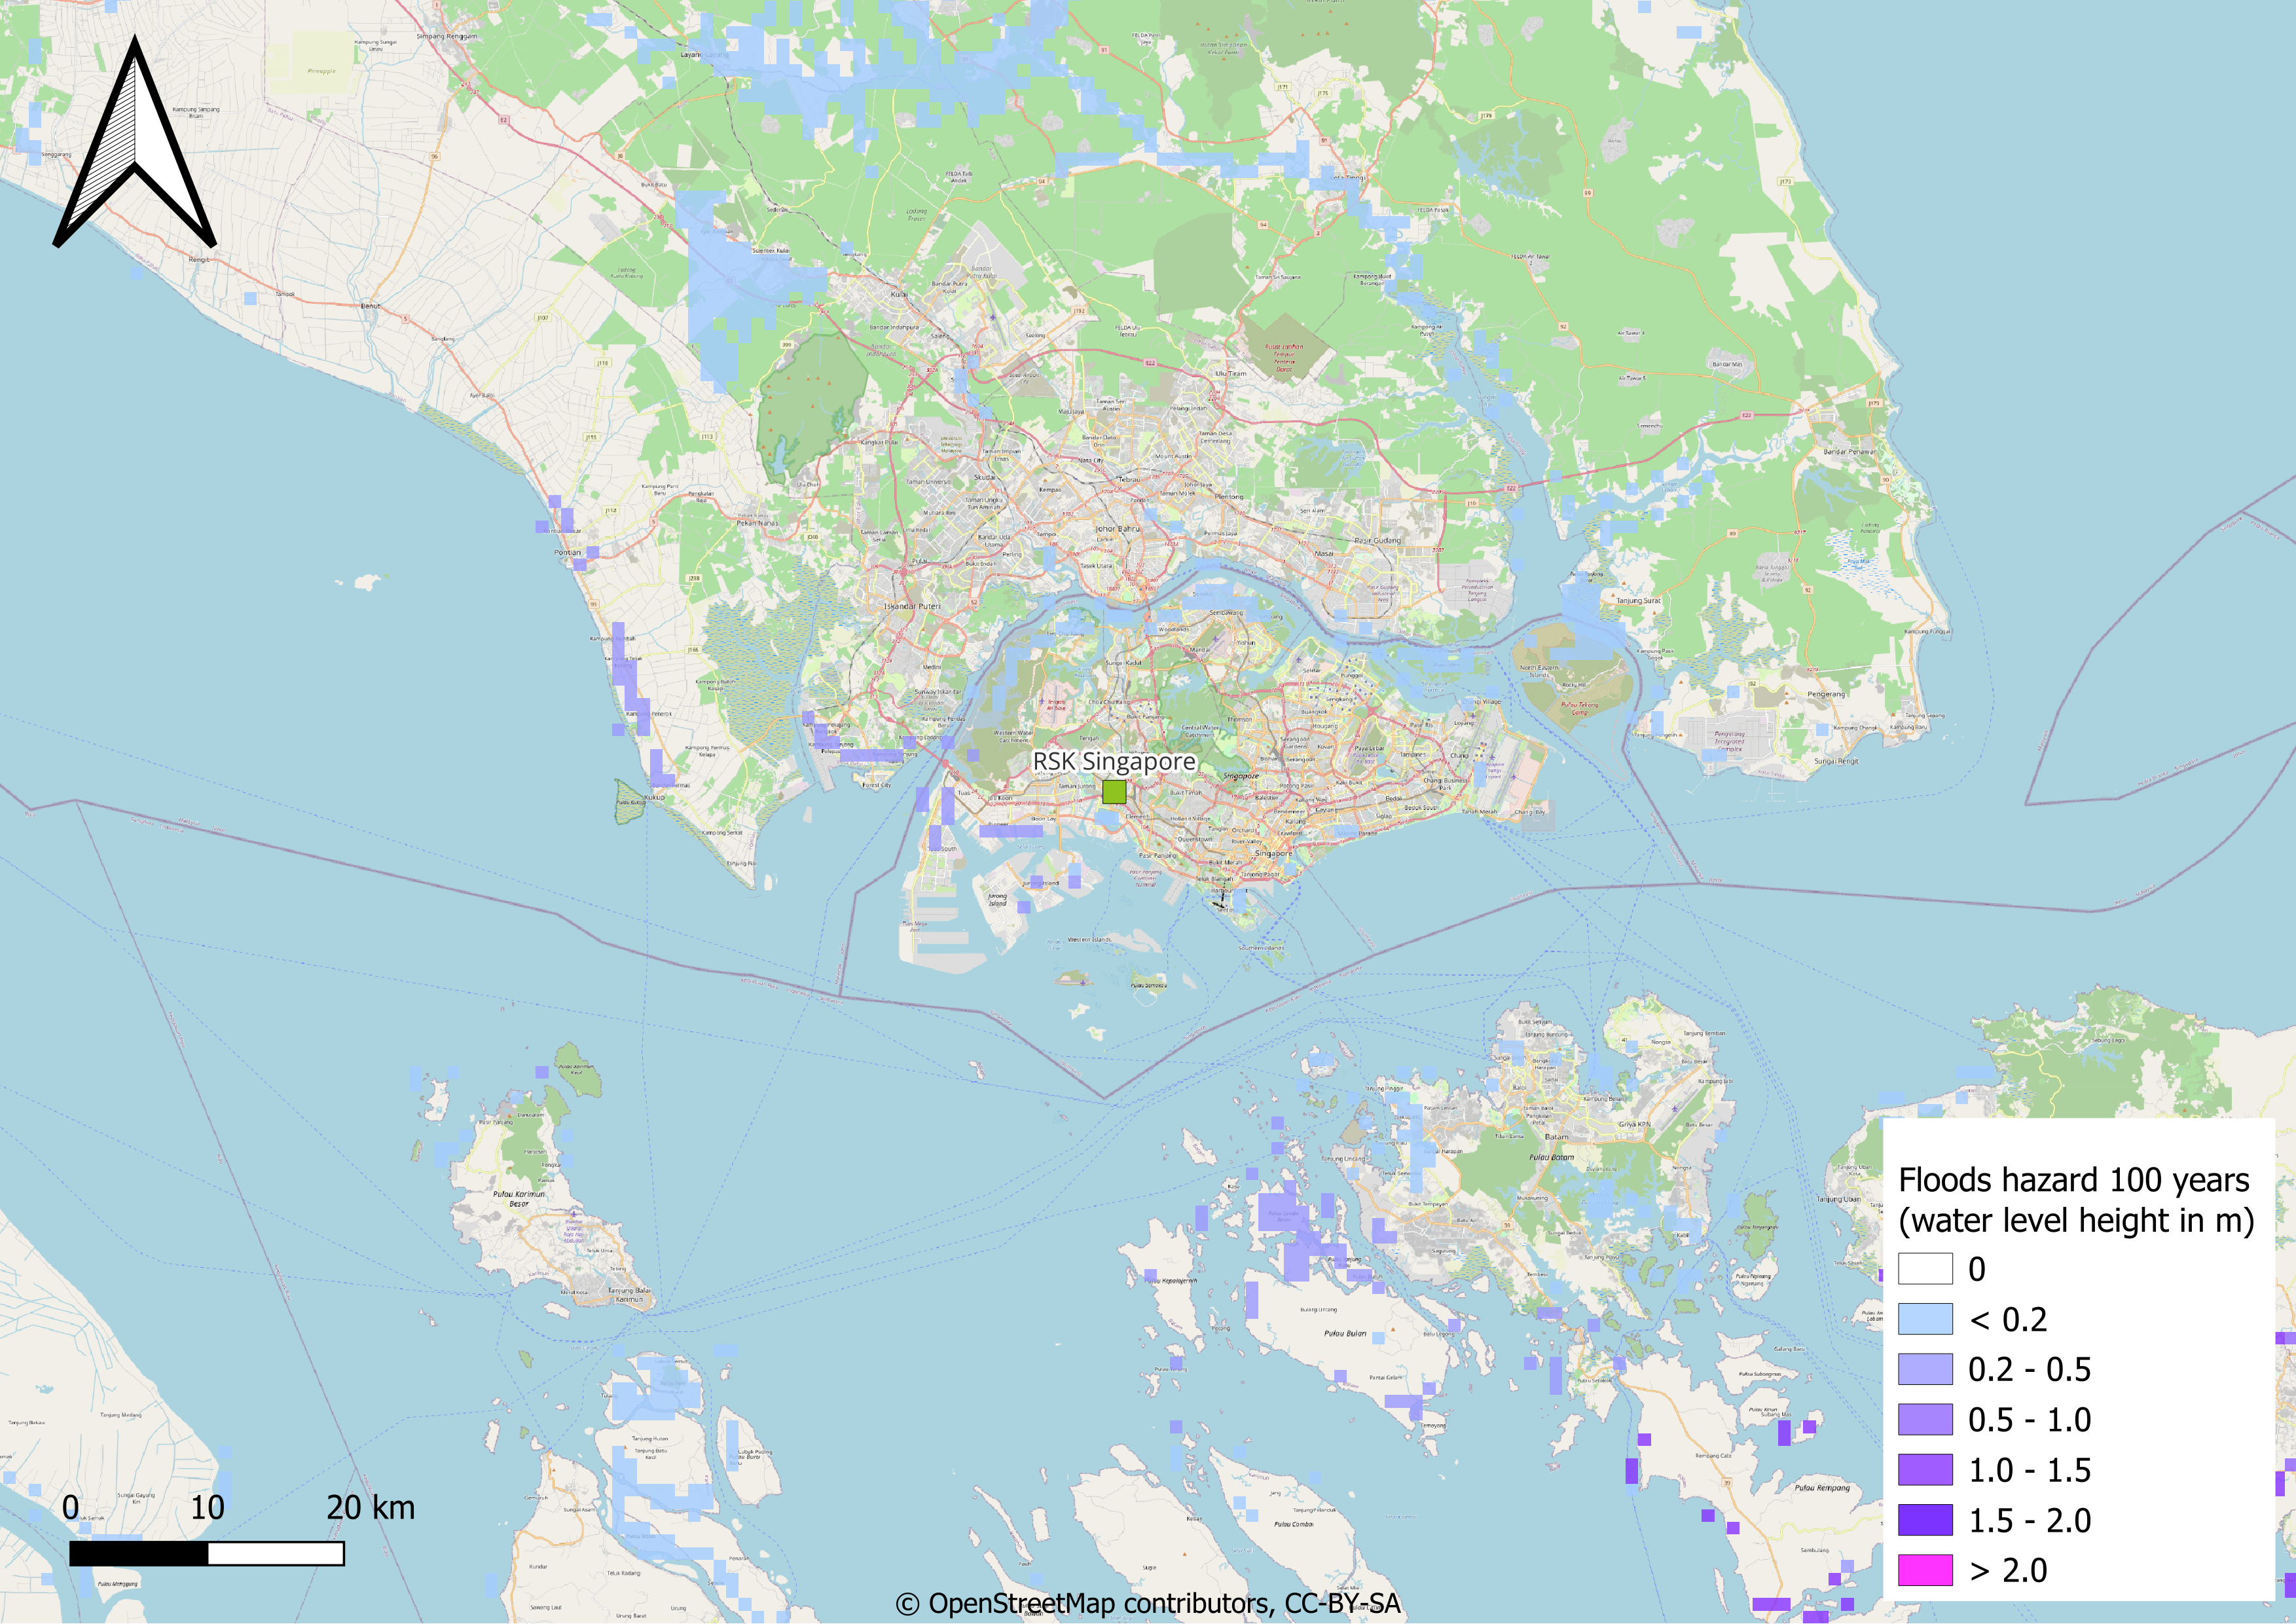
Present-day flood hazard in a 100 years return period in Singapore. The values are expected water level high in meters. The return period indicates that the flood of this magnitude is expected once every 100 years. Source: WRI - Aqueduct Floods.

Present-day flood hazard in a 250 years return period in Singapore. The values are expected water level high in meters. The return period indicates that the flood of this magnitude is expected once every 250 years. Source: WRI - Aqueduct Floods.
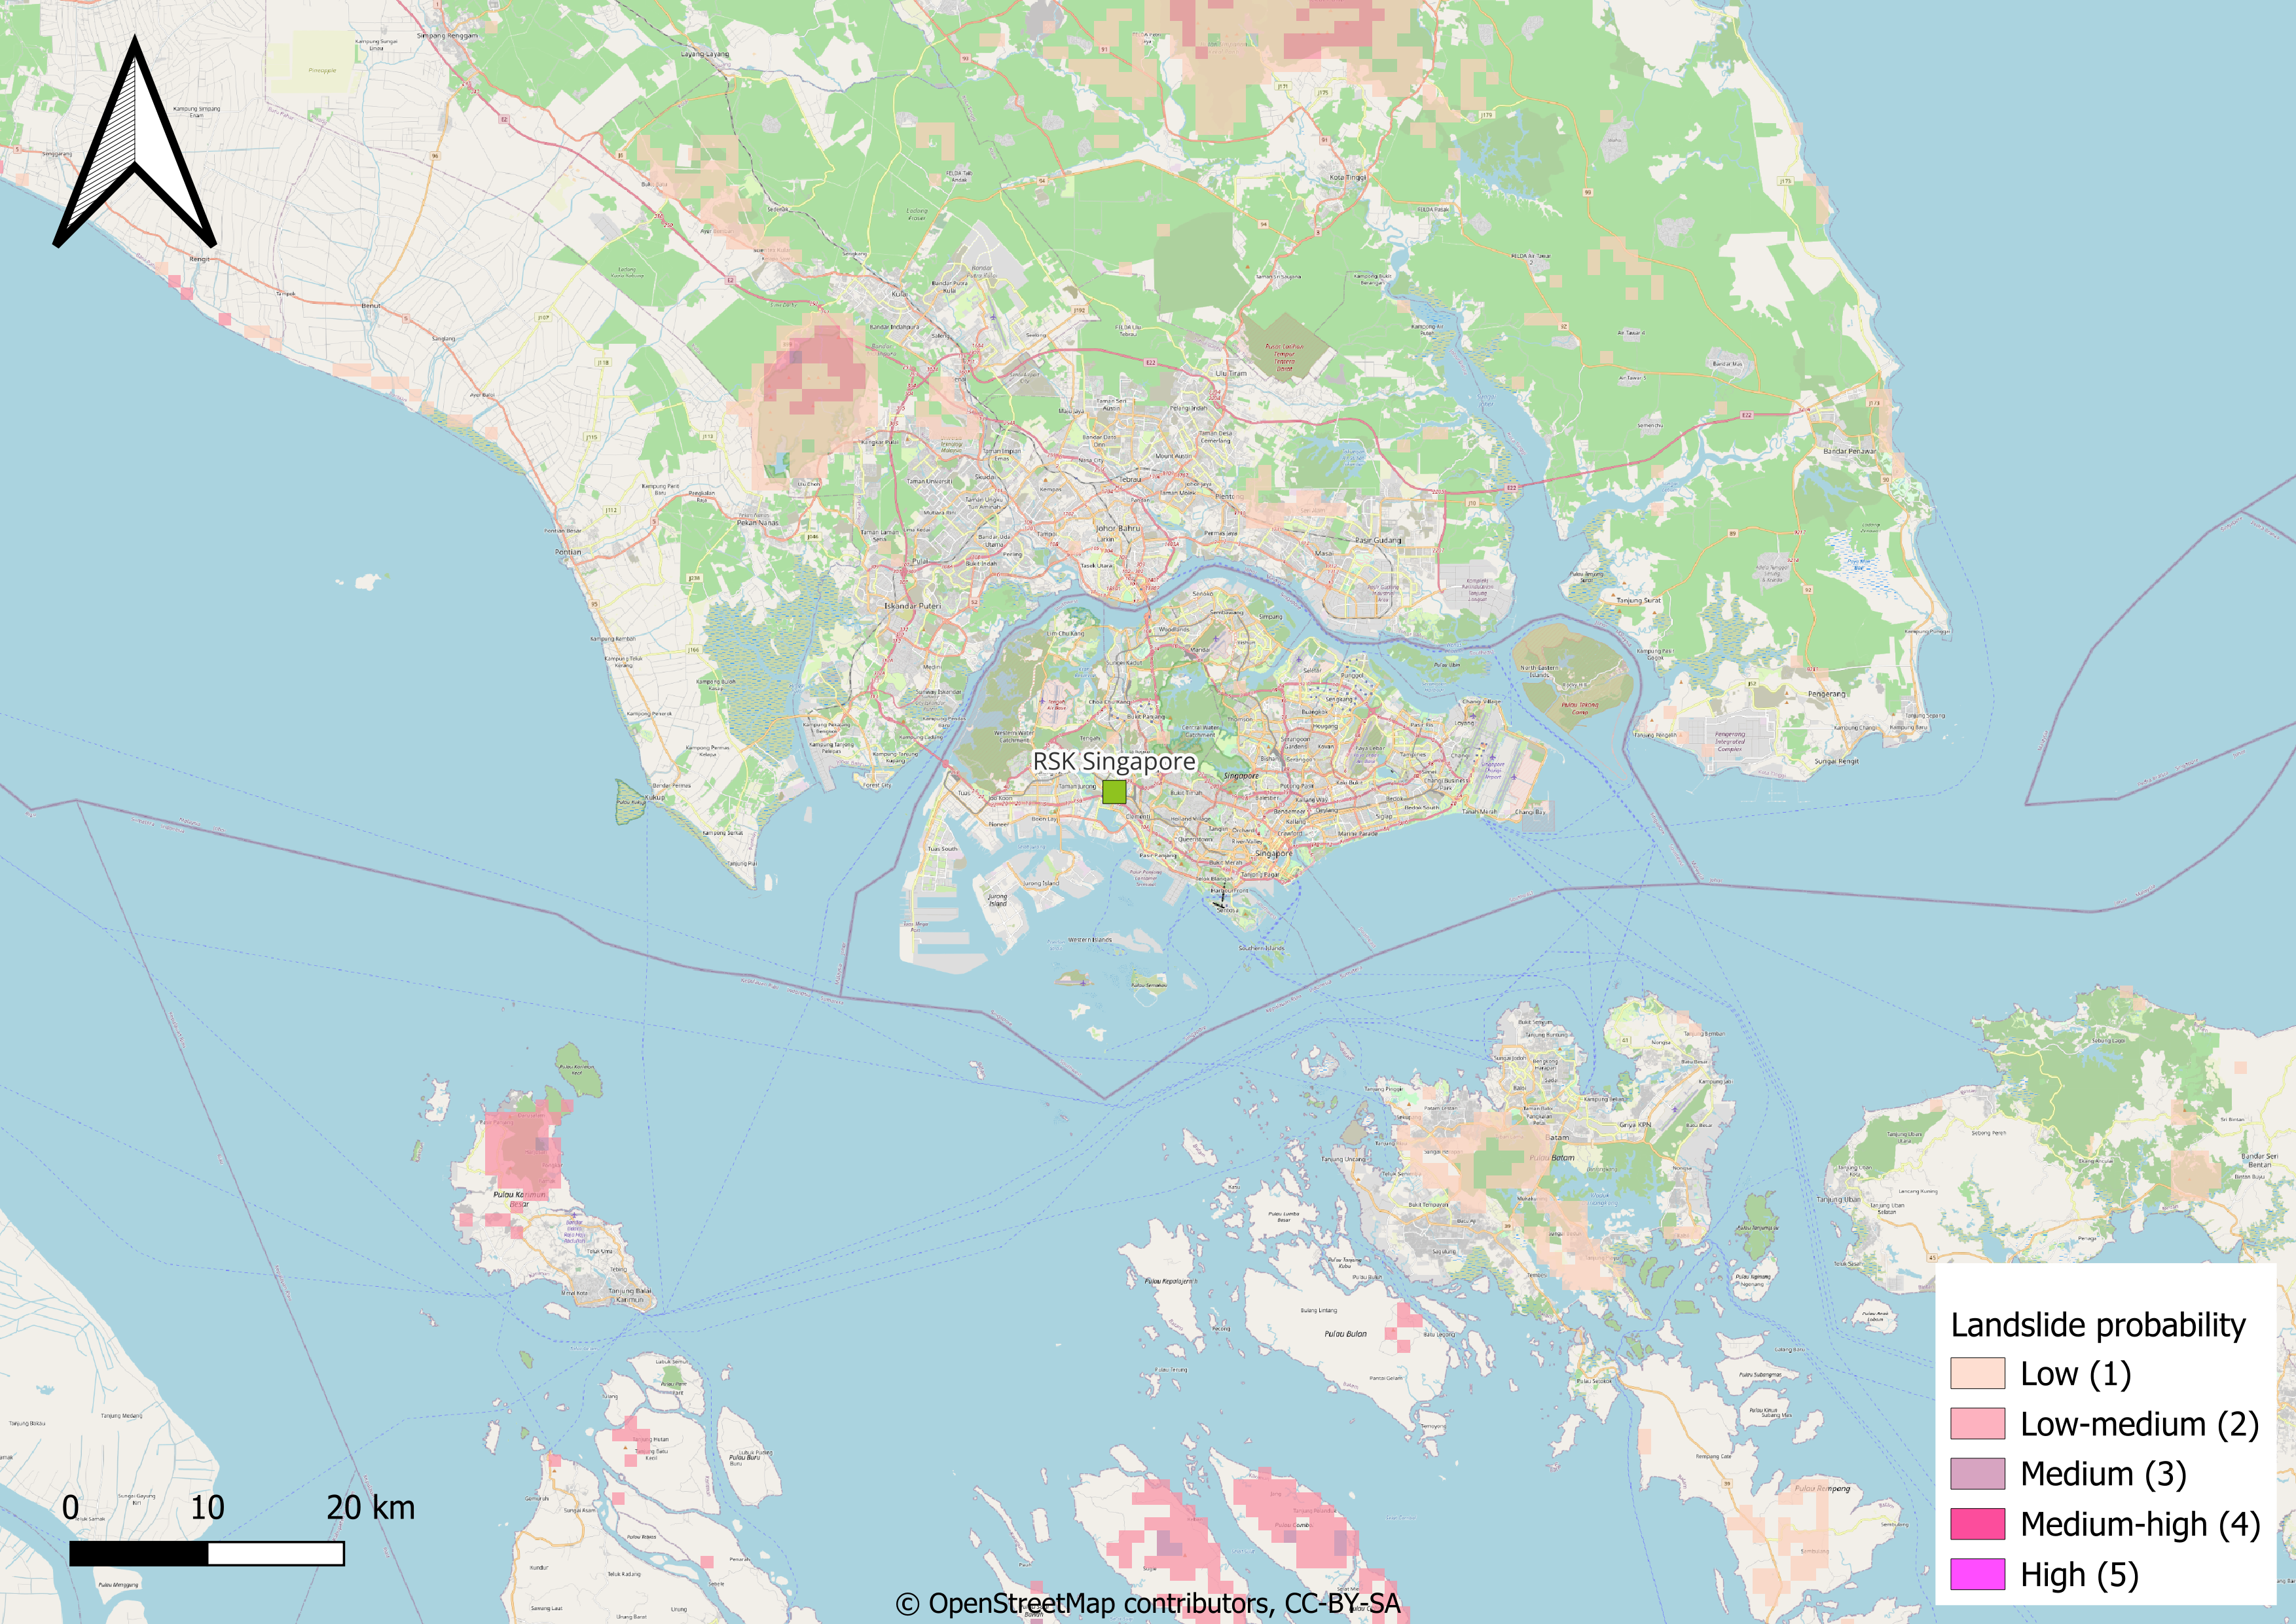
Present-day frequency of landslides triggered by precipitation meassured in expected annual probability and percentage of pixel of occurrence of a potentially destructive landslide event x 1000000. Source Global Assessment Report.
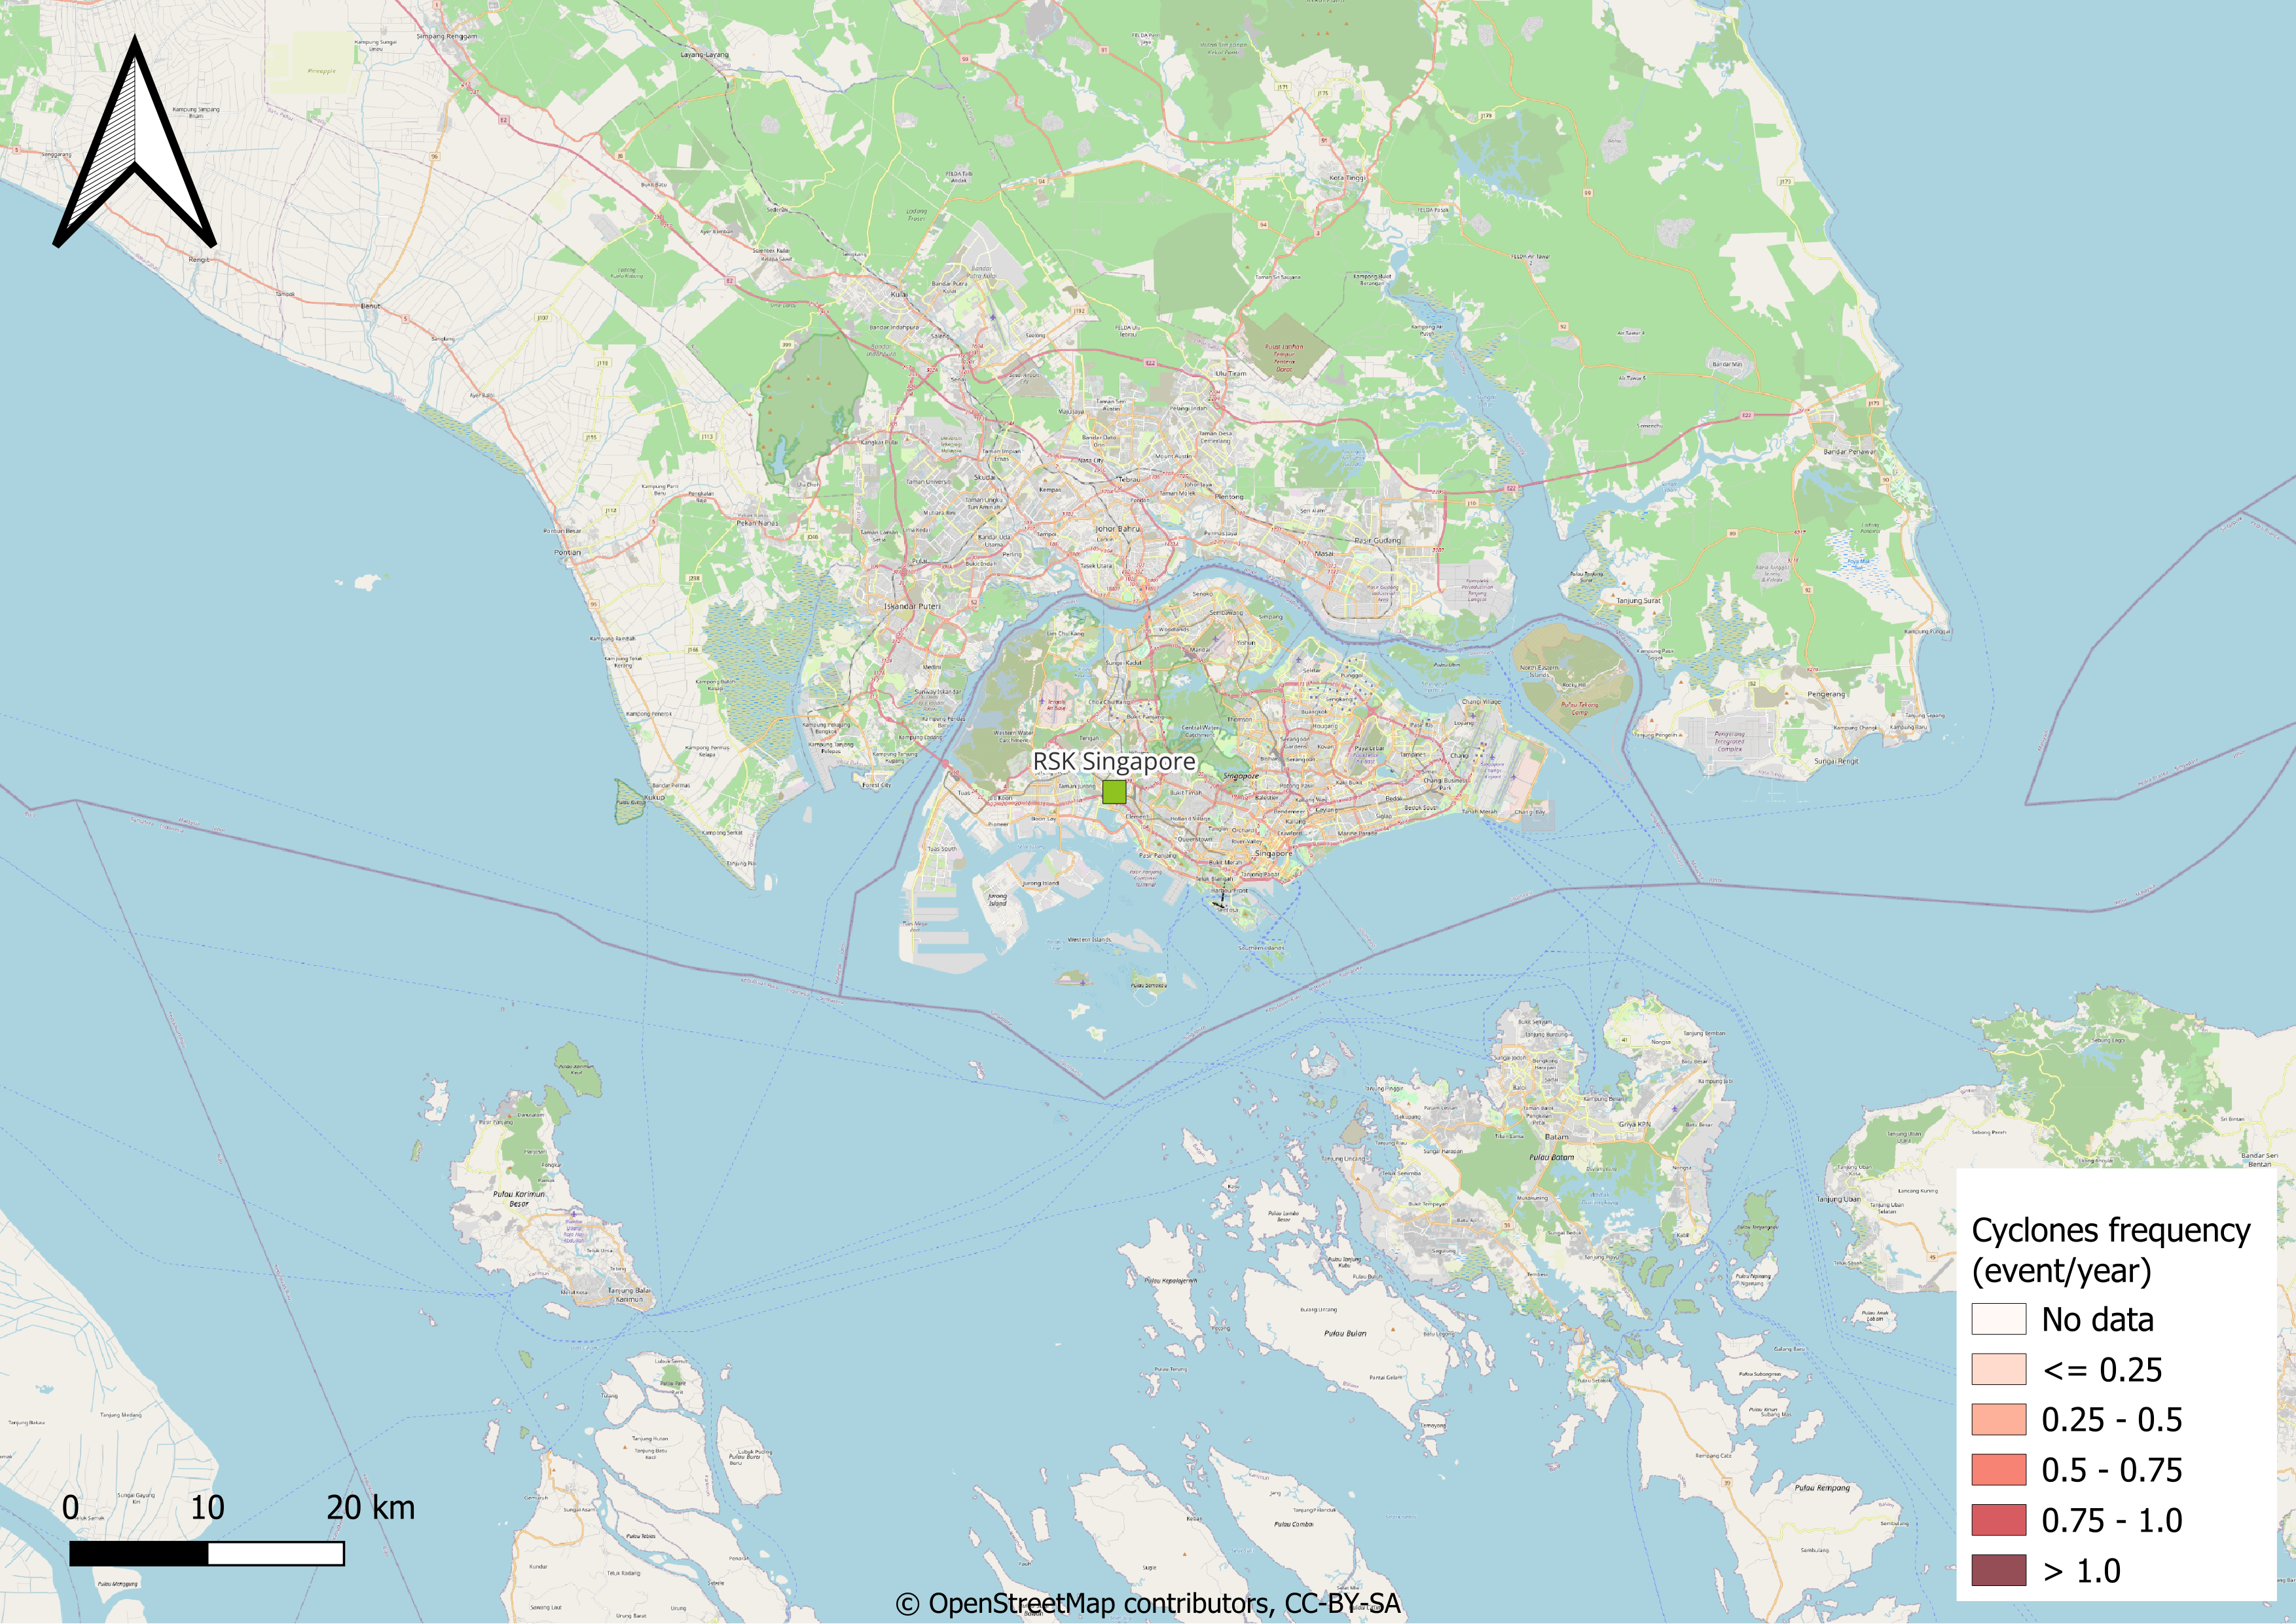
Tropical cyclones frequency in events per year is an estimate of the tropical cyclone frequency of Saffir-Simpson category 5. Source: IBTrACS processed by UNEP/GRID-Geneva.
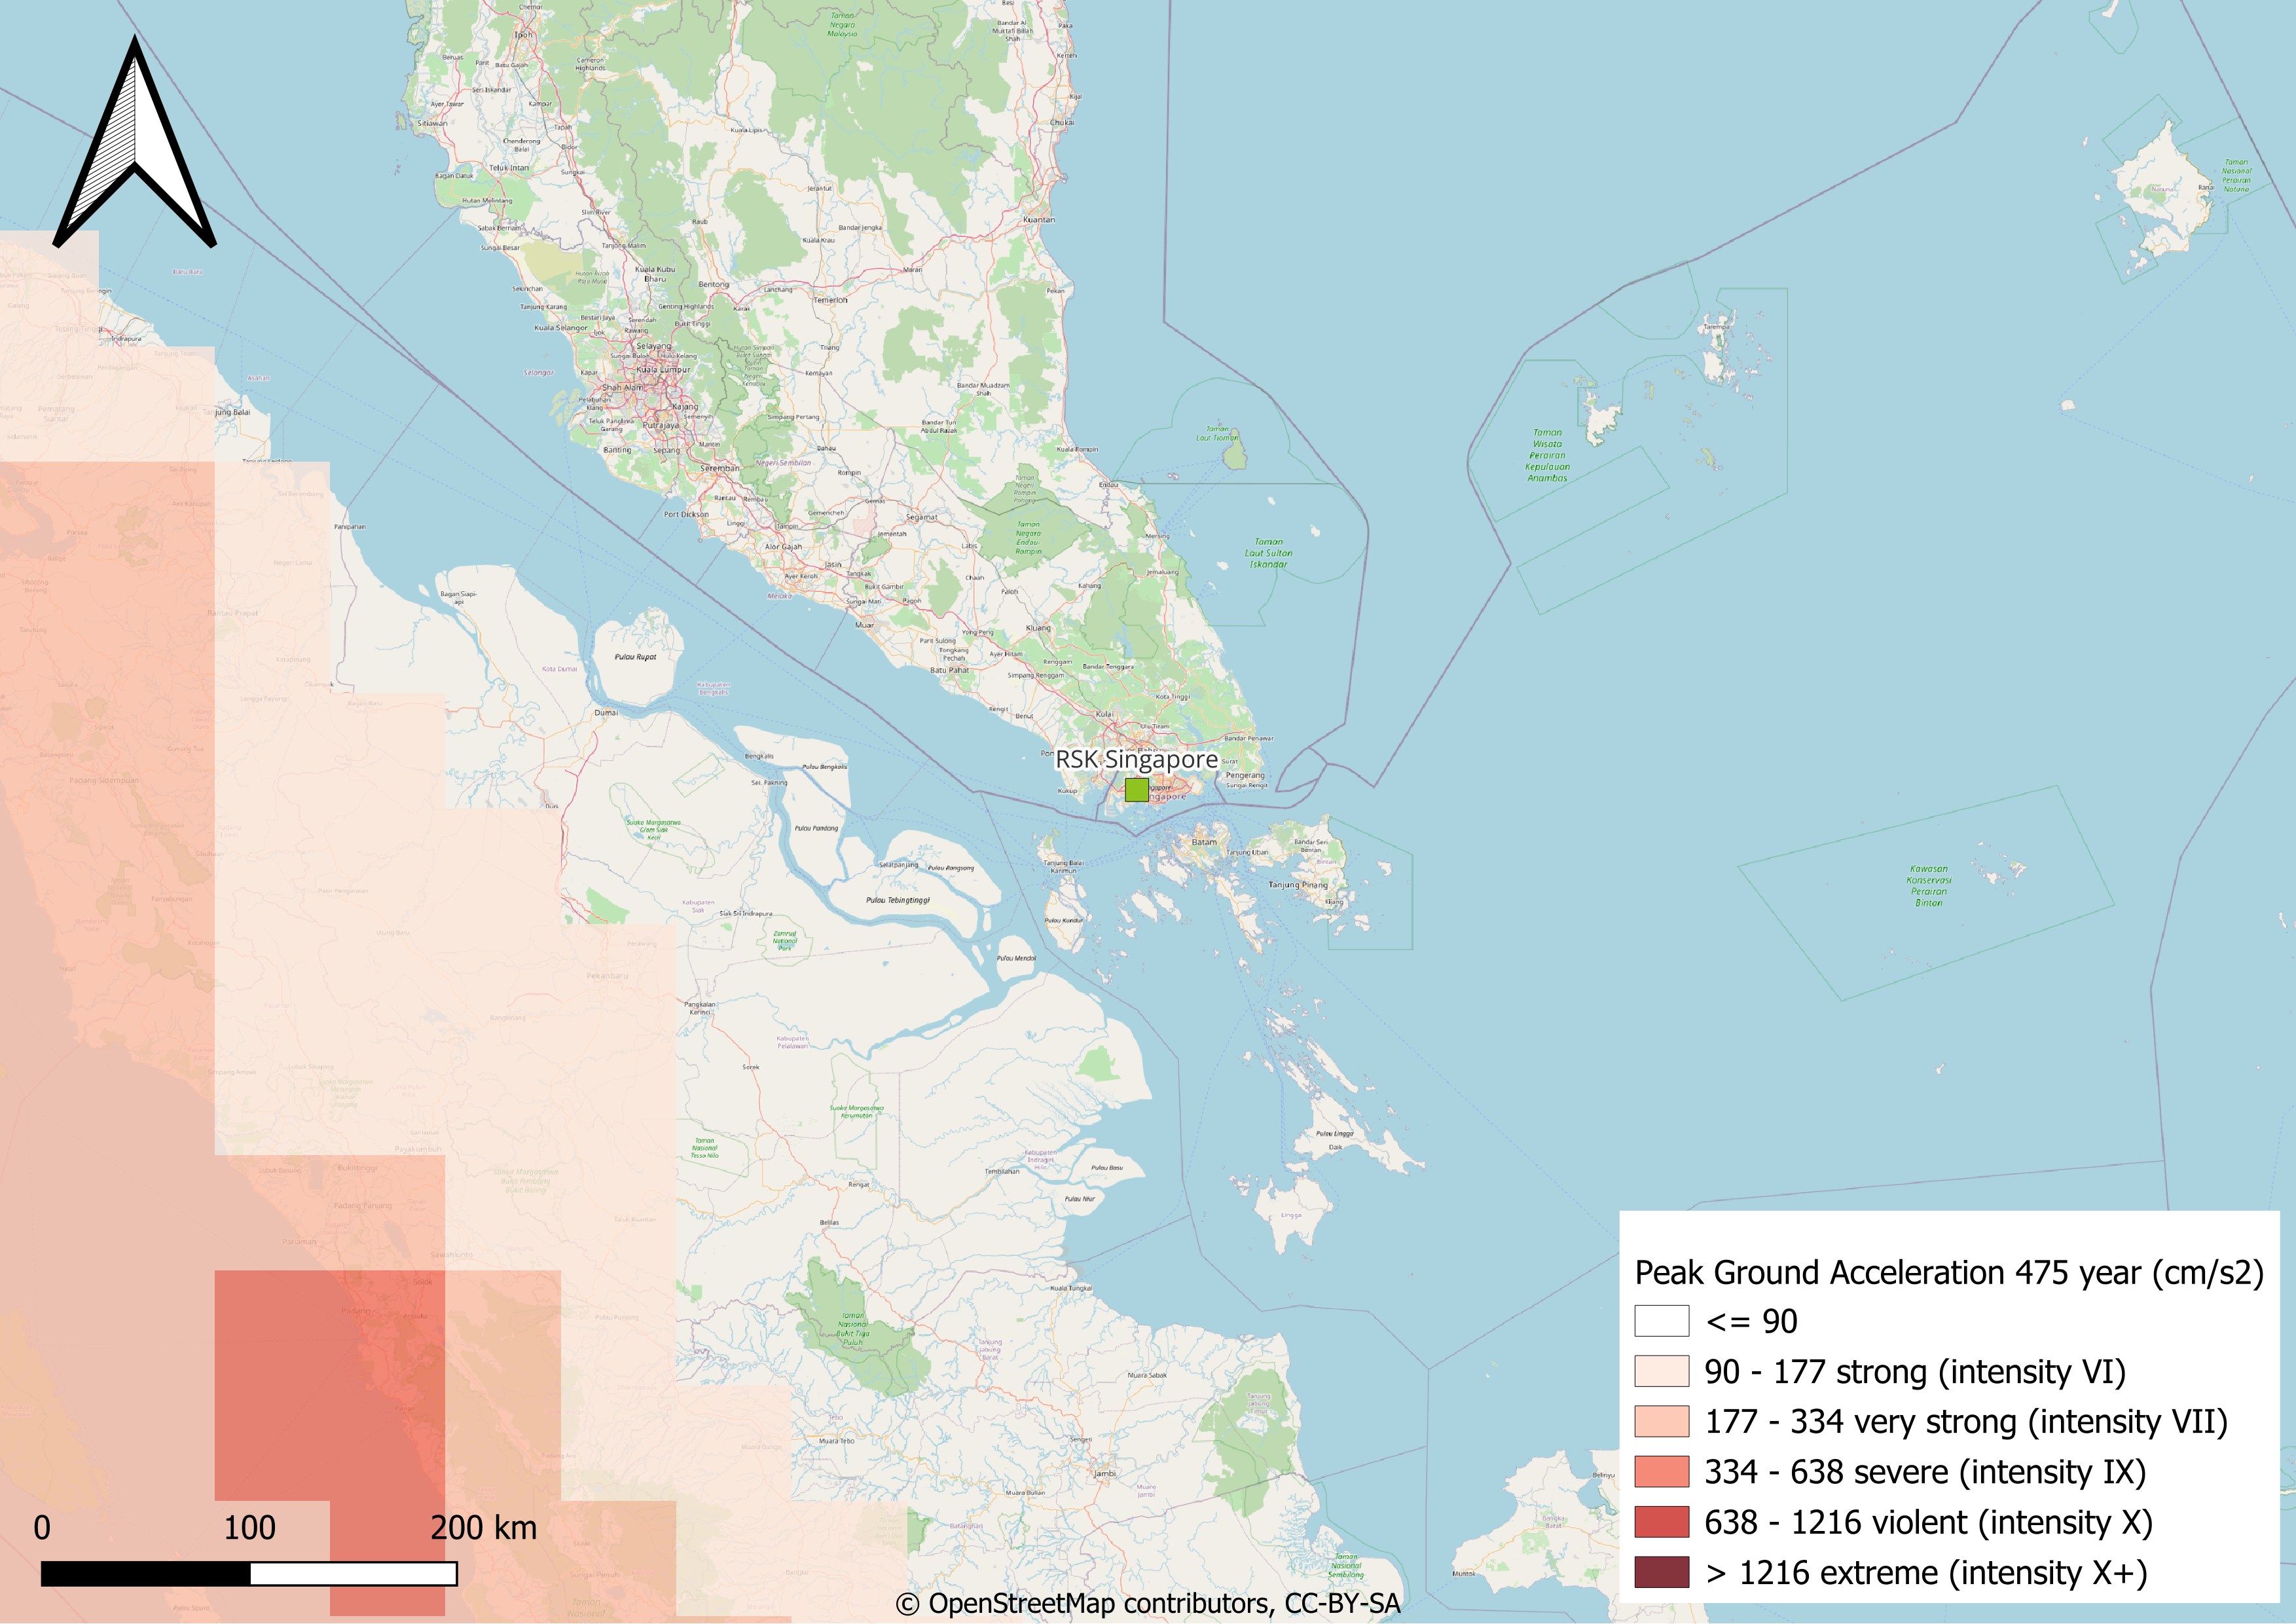
Estimated Peak Ground Acceleration (PGA) (cm/s2) in a 475 years retorn period earthquake in Singapore.
Projected Hazards
The baseline and projected future averaged value of each CID analyzed for this site is presented in the following table. The future projected values for years 2030 and 2050 are displayed for scenario RCP2.6 (green path) and RCP8.5 (unrestricted growth). The temporal evolution of the CID and the mean value for each time period are displayed by clicking on the CID name. Each climate-related hazard is evaluated in a specific section.
Climate Impact-Driver (chart link) |
Units |
Historical |
2030 | 2.6 |
2030 | 8.5 |
2050 | 2.6 |
2050 | 8.5 |
Source |
|---|---|---|---|---|---|---|---|
[-] |
0.8 |
0.9 |
0.9 |
0.9 |
0.9 |
||
days |
13.9 |
14.9 |
17.6 |
16.0 |
20.3 |
||
days |
29.5 |
27.2 |
27.8 |
30.8 |
29.6 |
||
°C |
29.6 |
31.1 |
31.3 |
31.6 |
32.5 |
||
°C |
28.2 |
29.7 |
29.9 |
30.2 |
31.1 |
||
°C |
26.3 |
27.5 |
27.7 |
28.0 |
28.7 |
||
°C |
23.8 |
25.0 |
25.2 |
25.4 |
26.2 |
||
°C |
3.3 |
3.6 |
3.6 |
3.6 |
3.8 |
||
mm yr-1 |
1633.0 |
1653.1 |
1644.9 |
1693.7 |
1666.8 |
||
days |
0.0 |
0.0 |
0.0 |
0.0 |
0.0 |
||
days |
360.0 |
360.0 |
360.0 |
360.0 |
360.0 |
||
days |
59.5 |
57.0 |
58.7 |
63.4 |
56.1 |
||
days |
0.0 |
0.0 |
0.0 |
0.0 |
0.0 |
||
mm |
73.3 |
75.6 |
74.6 |
81.4 |
86.2 |
||
mm |
137.2 |
147.0 |
132.9 |
148.5 |
149.9 |
||
°C |
33.3 |
34.8 |
35.9 |
35.6 |
36.0 |
||
°C |
28.7 |
29.9 |
30.1 |
30.2 |
31.0 |
||
°C |
26.1 |
27.3 |
27.7 |
27.8 |
28.5 |
||
°C |
23.6 |
24.8 |
25.0 |
25.3 |
26.1 |
||
°C |
27.8 |
29.1 |
29.3 |
29.6 |
30.4 |
||
°C |
27.5 |
28.8 |
29.0 |
29.3 |
30.0 |
||
m s-1 |
4.0 |
4.1 |
4.1 |
4.1 |
4.3 |
||
days |
249.7 |
226.9 |
227.1 |
225.5 |
206.9 |
||
mm yr-1 |
2027.4 |
1908.9 |
1949.2 |
2008.8 |
1877.6 |
||
mm yr-1 |
2362.0 |
2223.9 |
2270.9 |
2340.3 |
2187.5 |
||
mm d-1 |
7.9 |
8.1 |
8.3 |
8.6 |
8.8 |
||
days |
360.0 |
360.0 |
360.0 |
360.0 |
360.0 |
||
mm |
1969.1 |
1846.1 |
1887.6 |
1945.3 |
1814.8 |
||
mm |
2294.1 |
2150.8 |
2199.1 |
2266.4 |
2114.4 |
||
days |
360.0 |
360.0 |
360.0 |
360.0 |
360.0 |
||
days |
14.9 |
15.2 |
15.6 |
17.2 |
16.6 |
CIDs with the (bc) suffix correspond to the biased corrected variables. The bias factors and corrections applied are described in the next table.
Climate Impact-Driver |
Modelled |
Observed |
Deviation |
Factor |
Delta |
|---|---|---|---|---|---|
Daily maximum near surface air temperature |
29.61 |
28.20 |
5.00 % |
-1.41 °C |
|
Daily minimum near surface air temperature |
26.33 |
23.80 |
10.64 % |
-2.53 °C |
|
Near surface air temperature |
27.83 |
27.50 |
1.19 % |
-0.33 °C |
|
Precipitation |
2027.39 |
2362.00 |
-14.17 % |
1.17 [-] |
Mean temperature
Mean temperatures in Singapore are expected to increase by 1.5 ºC or even 2.5 ºC in the worst-case scenario. Therefore, average temperatures by 2030 might reach 29 ºC and by 2050 they might exceed the 29 ºC.
Climate Impact-Driver (chart link) |
Historical |
2030 | 2.6 change |
2030 | 8.5 change |
2050 | 2.6 change |
2050 | 8.5 change |
Source |
|---|---|---|---|---|---|---|
27.5 °C |
No Change |
Increase |
Increase |
Increase |
Extreme Heat
Singapore is characterised by a tropical rainforest climate, therefore average temperatures are high and extreme heat is a current hazard for the city. Nonetheless, as represented by the sharp increase in daily maximum air temperature, climate change is expected to exacerbate this phenomenon.
Climate Impact-Driver (chart link) |
Historical |
2030 | 2.6 - impact on hazard |
2030 | 8.5 - impact on hazard |
2050 | 2.6 - impact on hazard |
2050 | 8.5 - impact on hazard |
Source |
|---|---|---|---|---|---|---|
28.2 °C |
Increase |
Increase |
Increase |
Large Increase |
||
360.0 days |
No Change |
No Change |
No Change |
No Change |
||
360.0 days |
No Change |
No Change |
No Change |
No Change |
Cold spells and frosts
As a tropical climate, frost and ice do not affect the city and therefore cold spells and frost can be considered as a non-relevant hazard for Singapore.
Climate Impact-Driver (chart link) |
Historical |
2030 | 2.6 - impact on hazard |
2030 | 8.5 - impact on hazard |
2050 | 2.6 - impact on hazard |
2050 | 8.5 - impact on hazard |
Source |
|---|---|---|---|---|---|---|
0.0 days |
No Change |
No Change |
No Change |
No Change |
||
0.0 days |
No Change |
No Change |
No Change |
No Change |
Mean precipitation
Under all the scenarios analysed, mean precipitations are expected to decrease. Even though this variation might seem modest in percentage, the absolute reduction (about 200 mm/year) could be significant.
Climate Impact-Driver (chart link) |
Historical |
2030 | 2.6 change |
2030 | 8.5 change |
2050 | 2.6 change |
2050 | 8.5 change |
Source |
|---|---|---|---|---|---|---|
2362.0 mm yr-1 |
Decrease |
No Change |
No Change |
Decrease |
Floods and landslides
Floods and landslides might become a severe hazard in the long-term, due to a sharp increase in all the CID analysed. In spite of a reduction in average precipitations, the count of very heavy precipitation days is expected to largely increase. At the same time, the maximum 1-day and maximum 5-days precipitations are expected to increase by 2050.
Climate Impact-Driver (chart link) |
Historical |
2030 | 2.6 - impact on hazard |
2030 | 8.5 - impact on hazard |
2050 | 2.6 - impact on hazard |
2050 | 8.5 - impact on hazard |
Source |
|---|---|---|---|---|---|---|
59.5 days |
No Change |
No Change |
Increase |
Decrease |
||
73.3 mm |
No Change |
No Change |
Large Increase |
Large Increase |
||
137.2 mm |
Increase |
No Change |
Increase |
Increase |
||
14.9 days |
No Change |
No Change |
Large Increase |
Large Increase |
Aridity
- Due to the decrease in mean precipitations, the aridity in Singapore might increase in the future. In particular, the number of
consecutive dry days is expected to increase from about 14 to more than 20.
Climate Impact-Driver (chart link) |
Historical |
2030 | 2.6 - impact on hazard |
2030 | 8.5 - impact on hazard |
2050 | 2.6 - impact on hazard |
2050 | 8.5 - impact on hazard |
Source |
|---|---|---|---|---|---|---|
0.8 [-] |
Increase |
Increase |
Increase |
Large Increase |
||
13.9 days |
Increase |
Large Increase |
Large Increase |
Large Increase |
Drought
Similarly to aridity, the drough hazard in Singapore is expected to increase. The large increase in consecutive dry days and the decrease in the number of wet days is projected to drive this hazard.
Climate Impact-Driver (chart link) |
Historical |
2030 | 2.6 - impact on hazard |
2030 | 8.5 - impact on hazard |
2050 | 2.6 - impact on hazard |
2050 | 8.5 - impact on hazard |
Source |
|---|---|---|---|---|---|---|
13.9 days |
Increase |
Large Increase |
Large Increase |
Large Increase |
||
249.7 days |
Increase |
Increase |
Increase |
Large Increase |
Wildfire
According to future projections, Singapore is expected to be more affected by wildfires in the medium and long-term. In particular, the increase in consecutive dry days and the decrease in wet days might drive this hazard.
Climate Impact-Driver (chart link) |
Historical |
2030 | 2.6 - impact on hazard |
2030 | 8.5 - impact on hazard |
2050 | 2.6 - impact on hazard |
2050 | 8.5 - impact on hazard |
Source |
|---|---|---|---|---|---|---|
13.9 days |
Increase |
Large Increase |
Large Increase |
Large Increase |
||
4.0 m s-1 |
No Change |
No Change |
No Change |
Increase |
||
249.7 days |
Increase |
Increase |
Increase |
Large Increase |
Coastal flood
As an insular city, Singapore is highly exposed to coastal floods. According to future projections, the sea level will rise by 0.1 m by 2030 and by around 0.2m by 2050.
CID |
2030 | 2.6 |
2030 | 8.5 |
2050 | 2.6 |
2050 | 8.5 |
|---|---|---|---|---|
Relative sea level rise |
0.08 |
0.17 |
0.09 |
0.21 |
Conclusions
This section summarizes the climate-related physical hazards affecting the RSK office in Singapore. The projected future evolution of the hazards is graded between an increase to a large increase in the hazard. Some of the hazards are non relevant for a site. In the case of RSK Singapore, cold spells and frosts hazards can be disregarded.
Singapore is expected to face an increase in mean temperatures, which might exacerbate the city’s extreme heat. Mean precipitation is expected to decrease in the future, driving a rise in aridity, drought and wildfire hazards. On the other side, the variation in the precipitation patterns - with a decrease in overall rainfall, concentrated in fewer and more severe rainstorms - is expected to drive an increase in floods and landslides. The wind-related hazards are not expected to vary significantly, while the coastal floods are projected to increment in the future due to the sea level rise.
Hazard |
2030 | 2.6 - Estimated Physical Risk Change |
2030 | 8.5 - Estimated Physical Risk Change |
2050 | 2.6 - Estimated Physical Risk Change |
2050 | 8.5 - Estimated Physical Risk Change |
|---|---|---|---|---|
Extreme heat |
No Change |
No Change |
No Change |
Increase |
Cold spell and frost |
No Relevant |
No Relevant |
No Relevant |
No Relevant |
Floods |
No Change |
No Change |
Large Increase |
Increase |
Landslide |
No Change |
No Change |
Large Increase |
Increase |
Aridity |
Increase |
Large Increase |
Large Increase |
Large Increase |
Drought |
Increase |
Large Increase |
Large Increase |
Large Increase |
Wildfire |
Increase |
Increase |
Increase |
Large Increase |
Coastal flood |
No Change |
Increase |
No Change |
Increase |
Wind |
No Change |
No Change |
No Change |
Increase |